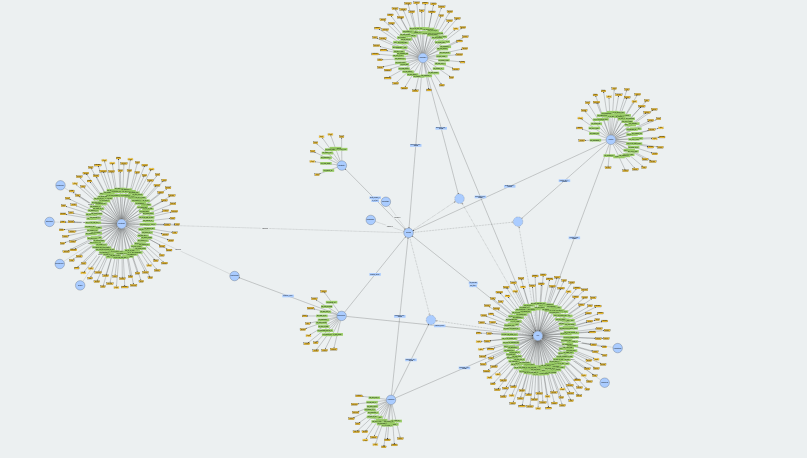
The Non-Perfoming Loan Ontology The Non-Performing Loan Ontology is a framework that aims to represent and categorize knowledge about non-performing loans using semantic web information technologies. Codenamed NPLO, it codifies the relationship between the various components of a Non-Performing Loan portfolio dataset.(NB: Non-performing loans are bank loans that are 90 days or more past their repayment date or that are unlikely to be repaid, for example if the borrower is facing financial difficulties).
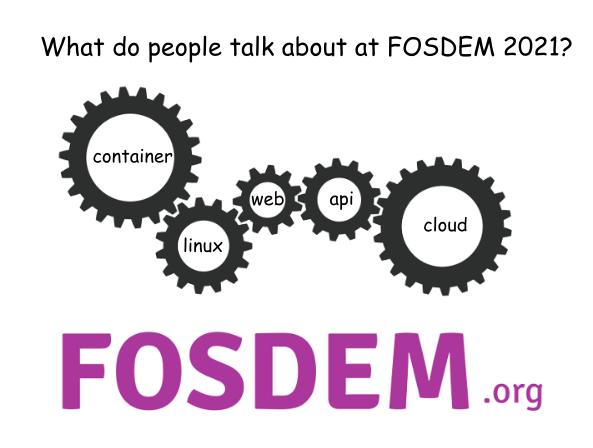
Introduction What is FOSDEM? FOSDEM is a non-commercial, volunteer-organized event centered on free and open-source software development (with a geographic focus on the European open source ecosystems / projects). FOSDEM is aimed at developers and anyone interested in the free and open-source software movement. It aims to enable developers to meet and to promote the awareness and use of free and open-source software.
FOSDEM is held annually since 2001, usually during the first weekend of February, at the Université Libre de Bruxelles Solbosch campus in the southeast of Brussels, Belgium.
Risk, Randomness, Uncertainty and other Ambiguous Terms Uncertainty versus Risk is a popular discussion topic among risk managers, especially after major risk management disasters. The debate can get really hairy and drift into deep philosophical areas about the nature of knowledge etc. Yet the significance of having an as clear as possible language toolkit around these terms should not be underestimated. Practical risk management typically shuns too deep excursions into the meaning of things, yet that is not quite compatible with the use of sophisticated methods and tools (such as a Risk Model ) that assumes an understanding of the scope and limitations of “knowledge”.
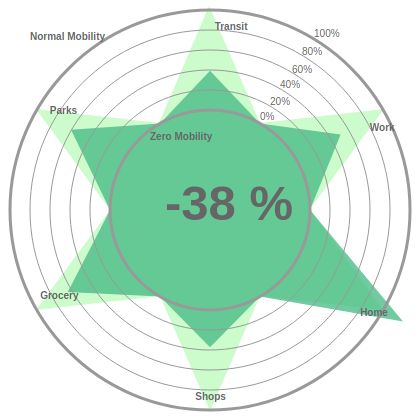
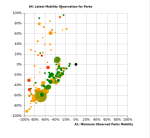
We introduce a global mobility index that averages Google mobility data across all available countries (weighting by population) to provide an overall view of how the pandemic has influenced human mobility
Constructing a Global Mobility Index (GMI) In previous posts (here, and here) we introduced new Open Risk Dashboard functionalities that integrate COVID-19 community mobility data (currently focusing on the datasets provided by Google).
As a reminder, these reports chart over time human mobility trends collected from mobile geolocation data. The granularity is by geography and across different categories of places / activities such as retail and recreation areas, groceries and pharmacies, parks, transit stations, workplaces, and residential areas.
Is the size of global debt truly “astronomical”? The notion of astronomical numbers and figures is quite frequently seeping in everyday language when large quantities of something are encountered in “normal” life. The strict definition of astronomical is obviously something of, or relating to, astronomy and astronomical observations but in common usage it also denotes something enormously or inconceivably large. This is, of course, because astronomical figures are inconceivably large!
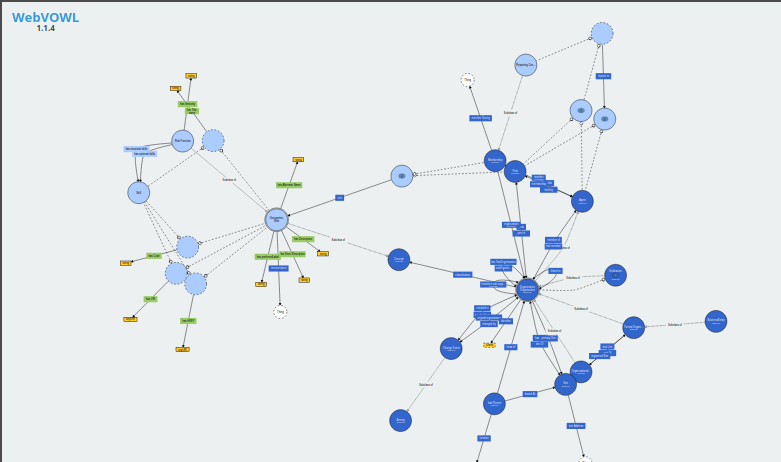
The Risk Function Ontology The Risk Function Ontology is a framework that aims to represent and categorize knowledge about risk management functions using semantic web information technologies. Codenamed RFO codifies the relationship between the various components of a risk management organization. Individuals, teams or even whole departments tasked with risk management exist in some shape or form in most organizations. The ontology allows the definition of risk management roles in more precise terms, which in turn can be used in a variety of contexts: towards better structured actual job descriptions, more accurate description of internal processes and easier inspection of alignement and consistency with risk taxonomies.
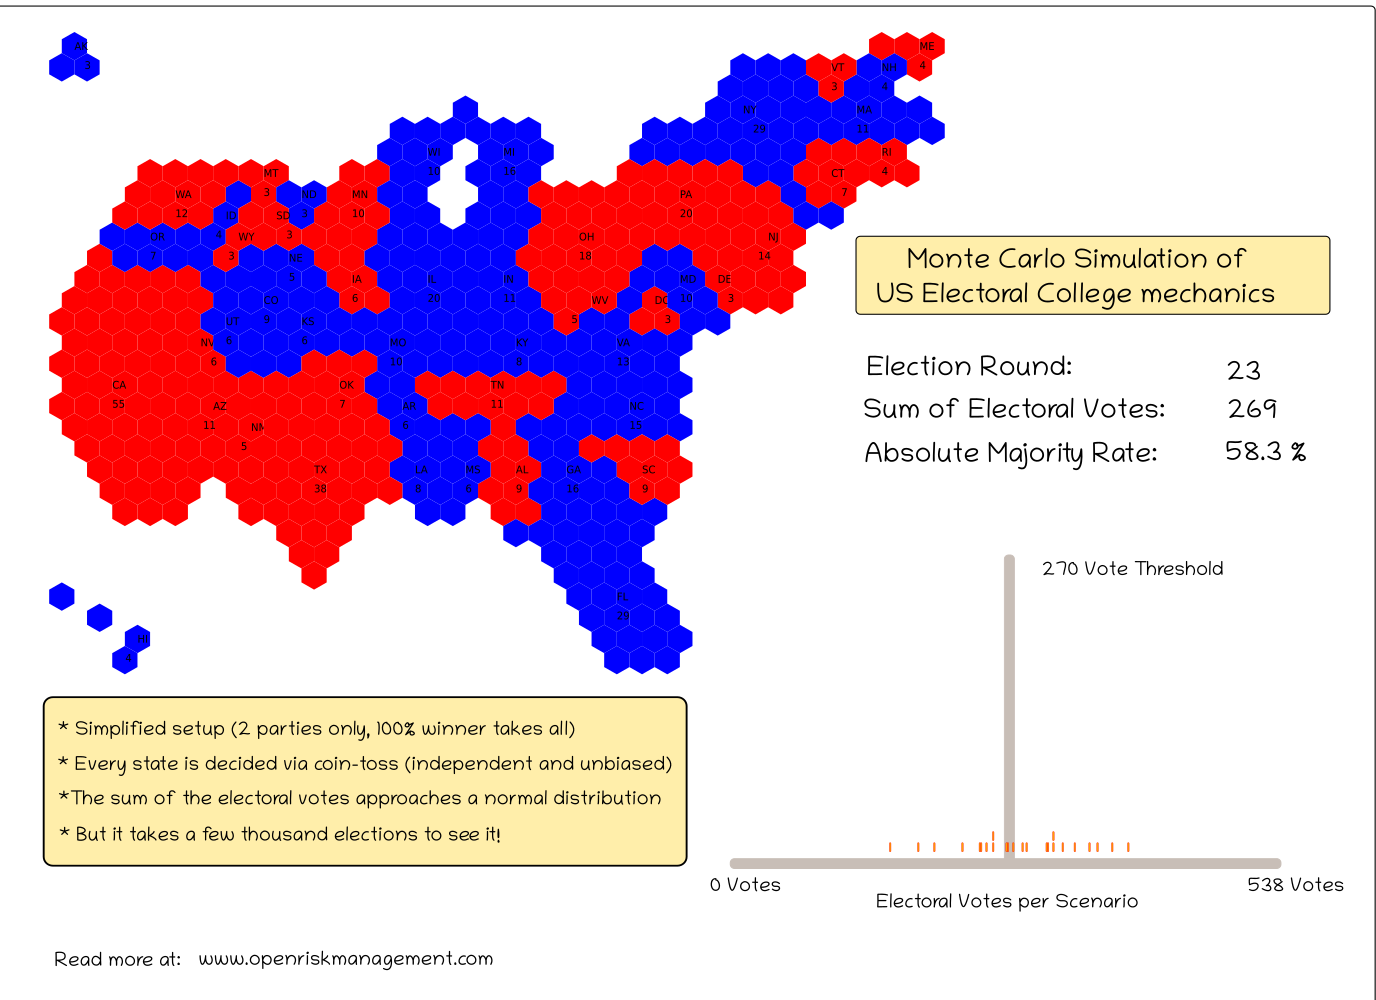
Using a simplified version of the rules of the US Electoral College system we illustrate how the use of Monte Carlo techniques allows exploring systems that show combinatorial explosion
The role of simulation in risk management and decision support A Simulation is a simplified imitation of a process or system that represents with some fidelity its operation over time. In the context of risk management and decision support simulation can be a very powerful tool as it allows us to assess potential outcomes in a systematic way and explore what-if questions in ways that might otherwise be not feasible. Simulation is used when the underlying model is too complex to yield explicit analytic models (An analytic model is one can be “solved” exactly or with standard numerical methods, for example resulting in a formula).
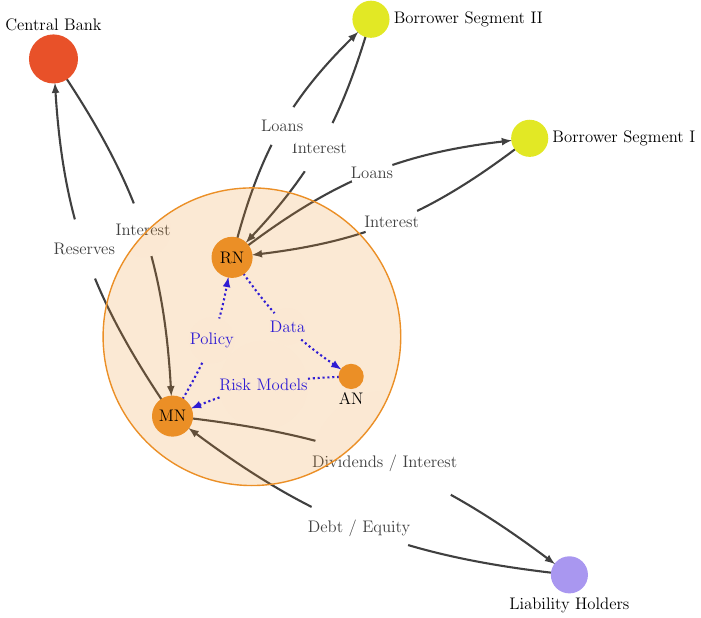
In this Open Risk White Paper, the first in a series of three, we introduce and explore the concept of federated credit systems as a potentially interesting domain for the application of federated analysis and federated learning.
Federated Credit Systems, Part I: Unbundling the Credit Provision Business Model As an architectural design and information technology approach, federation has received increased attention in domains such as the medical sector (under the name federated analysis), in official statistics (under the name trusted data) and in mass computing devices (smartphones), under the name federated learning.
In this (the first of series of three) white paper, we introduce and explore the concept of federated credit systems.
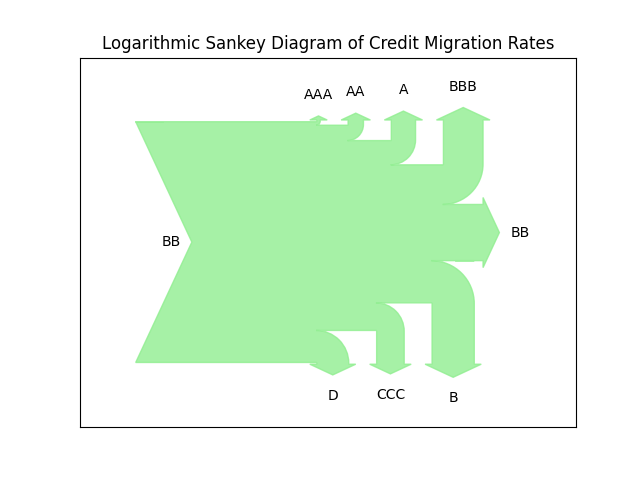
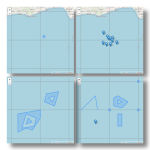
Sankey diagrams are very useful for the visualization of flows, especially when there is a conserved quantity. They can be tricky when some of the flows are much smaller than others. In the latest release of transitionMatrix we include an example of a log-scale version of Sankey
Using Sankey Diagrams Sankey Diagrams are a type of flow diagram composed of interconnected arrows. The width of the arrows is proportional to the flow rate. Sankey diagrams are often used in physical sciences (physics, chemistry, biology) and engineering but also in economics. They can be used to represent the relative role and significance of various inputs and outputs in a given process.
Sankey diagrams emphasize the major transfers within a system.
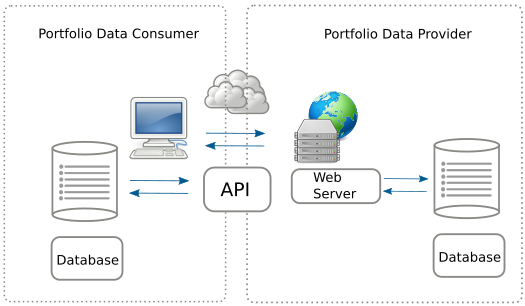
The 0.2 release of openNPL exposes a RESTful API that provides easy standardized online access to NPL credit portfolio data conforming to the EBA NPL templates
openNPL 0.2 release The open source openNPL platform supports the management of standardized credit portfolio data for non-performing loans. In this respect it implements the detailed European Banking Authority NPL loan templates. openNPL aims to be at the same time easy to integrate in human workflows (using a familiar web interface) and integrate into automated (computer driven) workflows.
The latest (0.2) release exposes a REST API that offers machine oriented access using, what is by now, the most established mechanism for achieving flexible online data transfers.
In the Back-to-School for 2020 we have more ways to access the Academy, new functionalities and more courses. In the rest of this post you will find a summary of the changes with pointers to further information where required
Risk Management will not be the same going forward: too much is at stake The summer is over in the Northern Hemisphere - and what an unusual summer has it been! Worldwide the implications and challenges of adjusting to a Covid-19 pandemic are still a major issue, affecting individuals, companies and governments.
At Open Risk we have been tracking and will continue to interpret the impact of the pandemic via a number of projects:
openNPL now Available in Dockerized Form Following up on the first release of openNPL the platform is now available to install using Docker. Running openNPL via docker is the installation option that simplifies the manual process (but a working docker installation is required!).
Docker Hub You can pull the latest openNPL image from Docker Hub (This method is recommended if you do not want to mess with the source distribution).
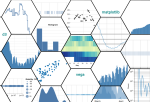
We explore a variety of distinct ways to visualize the same simple dataset. The post is an excursion into the fundamentals of visualization - a partial deconstruction of the process that highlights some common techniques and associated issues.
What this blog post is about (and what it isn’t) With the ever more widespread adoption of Data Science tools (defined loosely as the intensive use of data in decision-making), there is a renewed interest in Visualization as an effective channel for humans to understand information at various stages of the data lifecycle.
There is a large variety of data visualization tools which can produce an ever more bewildering variety of visualization types:
Non-Performing Loans The covid-19 crisis will certainly impact the concentration of Non-Performing Loans but given the special nature of this economic crisis compared (in particular) with the 2008 financial crisis it is unclear how precisely things will evolve.
In a previous post and white paper (OpenRiskWP07_022616) we discussed the importance of advancing open and transparent methodologies for managing the risks associated with such credit portfolios. Effective management of NPL is also a top regulatory priority.
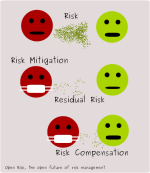
What is Risk Compensation? Risk Compensation is a behavioral model of human attitudes towards risk which suggests that people might adjust their behavior in response to the perceived level of risk. It follows that, depending on the strength of the effect, that it might counteract and even annul the impact of risk mitigation, if the updated attitude and behavior modifies the actual underlying risk
Examples of potential risk compensation effects abound A prominent example of potential risk compensation in recent times that established the concept in more formal terms in public policy debates concerned the beneficial role of safety belts in automobiles.
The community mobility reports and OpenCPM In a previous post we introduced new OpenCPM functionality that integrates COVID-19 community mobility data (currently from Google). The reports chart movement trends over time by geography, across different categories of places such as retail and recreation, groceries and pharmacies, parks, transit stations, workplaces, and residential.
While these reports are unlikely to persist as open data sources in the long term, the current availability (as of May 2020) enables providing within OpenCPM a mobility data dashboard that can help draw insights through visualization and statistical analysis.
The community mobility reports and OpenCPM As the COVID-19 pandemic unfolded technology providers (most notably Google and Apple) made available to the public aggregated and anonymized data about human mobility in the crisis period (on the basis of smartphone location data). These Community Mobility Reports provide insights into how mobility patterns changed in response both to pandemic news and policies aimed at combating COVID-19.
The reports chart movement trends over time by geography, across different categories of locations and activities, such as retail and recreation, groceries and pharmacies, parks, transit stations, workplaces, and residential.
Course Content This course is a CrashProgram (short course) introducing the GeoJSON specification for the encoding of geospatial features. The course is at an introductory technical level. It requires some familiarity with data specifications such as JSON and a very basic knowledge of Python
Who Is This Course For The course is useful to:
Any developer or data scientist that wants to work with geospatial features encoded in the geojson format How Does The Course Help Mastering the course content provides background knowledge towards the following activities:
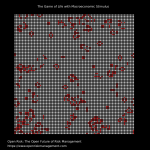
Agent-Based Models The origins and early years According to Wikipedia an agent-based model (ABM) is
ABM: class of computational models for simulating the actions and interactions of autonomous agents (both individual or collective entities such as organizations or groups) with a view to assessing their effects on the system as a whole.
A cellular automaton is a particular class of ABM. It is a discrete dynamical model used and studied in a variety of fields: computer science, mathematics, physics, complexity science, theoretical biology among others.
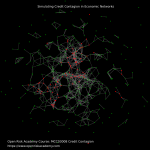
Course Content This course is an introduction to the concept of credit contagion. It covers the following topics:
Contagion Risk Overview and Definition Various Contagion Types and Modelling Challenges The Simple Contagion Model by Davis and Lo Supply Chains Contagion Sovereign Contagion Who Is This Course For The course is useful to:
Risk Analysts across the financial industry and beyond Risk Management students Quantitative Risk Managers developing or validating risk models How Does The Course Help Mastering the course content provides background knowledge towards the following activities: