Graphs for Double and Quadruple-entry Accounting
In a new Open Risk white paper we develop the concept of an accounting graph as an intuitive and flexible tool that can faithfully represent widely used accounting concepts. Weighted directed multigraphs representations can model standard double-entry bookkeeping (DEB) of individual accounting entities but can also be extended to to larger economic networks that feature multiple transacting entities (so-called quadruple-entry accounting). Such accounting graphs are promising both as educational tools and towards the application of computational tools on accounting data.
The awkward relation of accounting with mathematics
According to Wikipedia, Accounting, also known as accountancy, is the process of recording and processing information about economic entities, such as businesses and corporations. Accounting measures the results of an organization’s economic activities and conveys this information to a variety of stakeholders, including investors, creditors, management, and regulators. Practitioners of accounting are known as accountants. The terms accounting and financial reporting are often used interchangeably.

While in popular culture accountancy is almost synonymous to boring, in reality it is a core knowledge management technology that has supported complex societies from the earliest days, and to some extent even defined them. The value of good accounts becomes suddenly visible when a corporation collapses amid revelations of fraudulent accounts, or a country declares bankruptcy after being found to be cooking the numbers. The French go as far to say: Les bons comptes font les bons amis, good accounts as the basis of social harmony. More hidden from broad view, but not less relevant: what and how we choose to account and what we choose to leave unaccounted. The information intensity and sustainability challenges of modern economies taxes age-old accounting conventions and processes that have been developed historically to support management and communication objectives during simpler times. Prominent among the things we collectively have chosen as societies leave unaccounted for is environmental impact of economic activity, the contribution of social activities that are not based on monetary exchanges and much more. Yet if we are going to achieve sustainable economies these blind spot must be addressed.
Old paper-based accounting methods have by now been largely migrated to digital re-incarnations, as part of the so-called digital transformation process. Digitization is in many ways an upgrade (though not without its drawback), which creates significant opportunities for more effective management and accounting methodologies. While some relevant digital technologies, e.g., XBRL are already seeing adoption, new accounting constructs that capitalize on the possibilities of the digital realm remain largely a task for the future. The important takeaway for us is that the expansion of accounting technologies to better serve complex needs cannot happen without some sort of revival of its mathematical codification. The quote by mathematician Arthur Cayley at the top of the post goes back to the 19th century. It is remarkable to confirm that not much has changed in the intervening centuries! Perhaps nobody has articulated the frustration of the disconnect between two evidently nearby disciplines more forcefully than Prof. David Ellerman. Quote1:
Connecting the accounting dots
Within this broader canvas we continue exploring a small corner that focuses on the utility of mathematical graph structures. In a new white paper we explore the degree to which accounting concepts can be represented as accounting graphs, with an eye towards the deeper integration of financial and non-financial accounts both within and across organizations.
The idea of introducing mathematical graphs (networks) in the analysis of economic / financial systems is hardly new. The modeling of economic agents as graph nodes in graph networks is a well developed practice in many different domains. A large range of possible economic relations can be represented by edges encoding a variety of financial or other information. In previous white papers (WhitePaper8, WhitePaper10 we discussed the technical choice of using property graphs and how such representations can capture among others the elaborate contractual relationships between agents.
The formulation of accounting processes is somewhat similar (one can still think of accounting entities as nodes and transactions as edges) but it requires further condensation of information, a reduction of complexity using various heuristics and recipes. Nevertheless accounting must retain a certain consistency, if the accounts are to be trusted and fit for purpose. The most famous such consistency requirement, something that distinguishes accounting from other forms of knowledge management is the ingenious double-entry bookkeeping (DEB) principle: every transaction is recorded twice, affecting two accounts (debit and credit). Thus the first order of business is to find a suitable graph category that can serve the role of mathematical scaffolding on which to build accounting technologies.
Remarkably, a certain corner of graph theory accommodates this cornerstone accounting principle in a very natural way. More narrowly defined than the property graphs mentioned above, a certain class of graphs (specifically, weighted directed multi-graphs) turns out to have just the right information structure to represent conventional accounting. It also provides a fertile path for generalizations, e.g., when considering multiple accounting entities. In this direction it helps making mathematically more concrete the notion of quadruple-enty accounting.
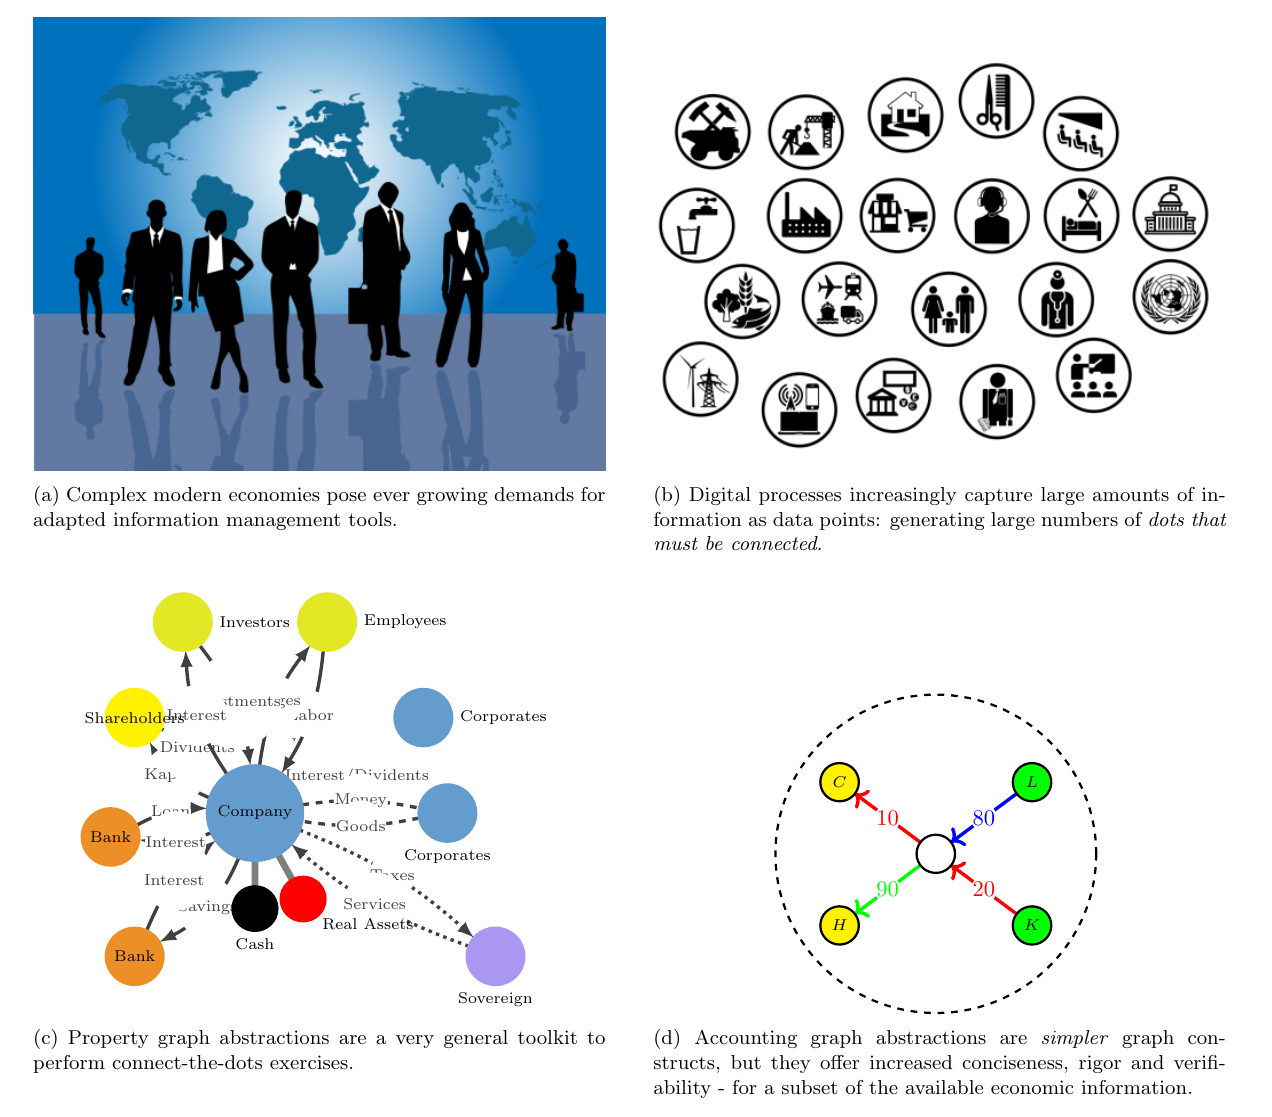
This overall journey is summarized in the following panels:
Double-entry bookkeeping as an accounting graph
Graphs are simply collections of nodes that are connected with edges. The core computational tool that makes directed graphs the natural conduits for DEB methodologies is the incidence matrix of a graph. This is a matrix where rows range over nodes (accounts) and columns range over edges (transactions). The matrix tabulates which node is associated with which edge. When the edge is emanating from the node the corresponding matrix element is a negative weight, when the edge is terminating on a node, the weight is positive. The transactions and accounts balancing requirement is translated in this language as the requirement that the columns of the matrix sum to zero. What Rambaud et al.2 call a balance vector.
The two B matrices below illustrate different ways of using an incident matrix to representing a household engaging in a simple loan transaction: borrowing from a bank.
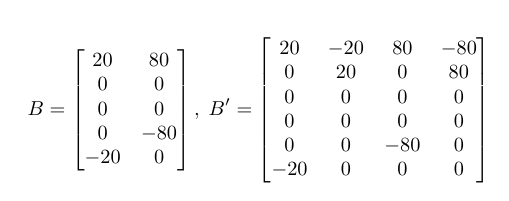
The columns represent different transactions. For example the first column of the left matrix indicates an amount of 20 CU is subtracted from the fifth account and added to the first account. In graphical form the above matrices are shown in the next panels. For example a borrowing transaction (the blue edge) creates a link (transfer) between the Loan account and the Cash account of a borrower.
The left and central panels represent these transactions using two related but slightly different graph structures. Namely there is both a direct and reified way to represent edges in a directed graph. Reification in this context means that instead of linking two accounts directly with an edge, we turn the link into a virtual node and re-route all transactions via this central node (the central panel). The right-most panel show how to consolidate the information (by summing up multiple edges between the same nodes).
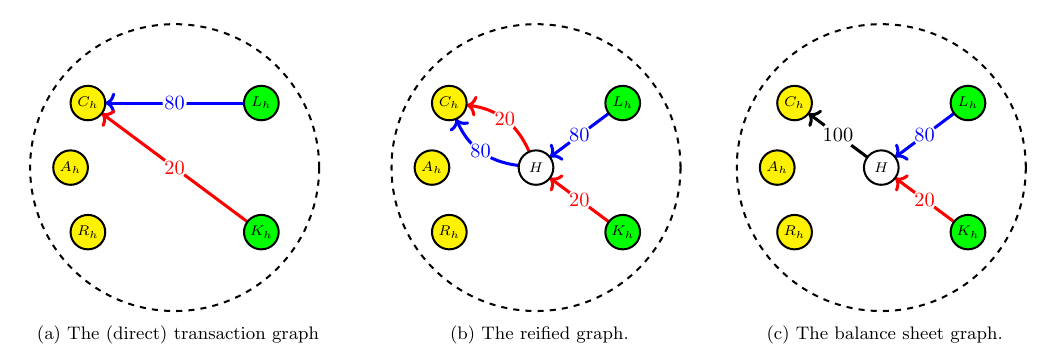
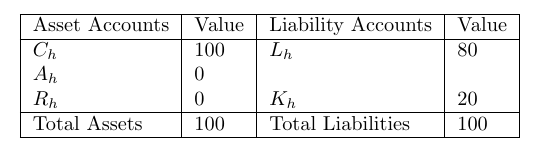
The benefit of the reification exercise can be seen in the third panel, which is basically a visual representation of the well-known balance sheet.
Of course there is much more to be said here about the application of such graphs to represent DEB accounting. The detailed associations, definitions and manipulations (and required simplifications) involved in the representation of double-entry accounting as a graph are available in the paper.
Extending the graph representation to quadruple-entry accounting
The extension of the accounting graph framework towards quadruple entry accounting (QEB) of multiple entities is quite intuitive. Quadruple-entry accounting is not something actively practiced, but the compilation of national statistical accounts (the processes that produce numbers such as the GDP) aims to adhere as much as possible to the same consistency principles as DEB, but now involving multiple accounting entities.
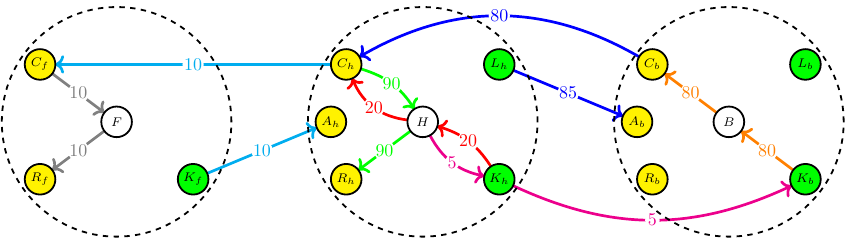
In the QEB context, transactions that are external, whether exchanges of tangible or financial assets, creation of liabilities etc. are modeled as edges between distinct groups of accounts, belonging to different entities. The incidence matrix Q of this larger accounting graph is segmented into blocks, representing the accounts of distinct entities. External transactions are now the columns connecting nodes belonging to different blocks.
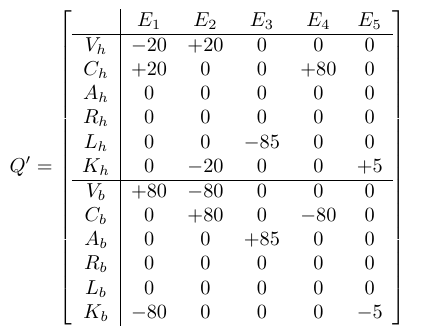
As an example, the above incidence matrix Q offers more elaborate modeling of the same borrowing transaction. Importantly, the creditor is explicitly represented and the exchanges between borrower and creditor are present as external edges (blue and magenta). Notice that all columns still obey the zero sum constraint.
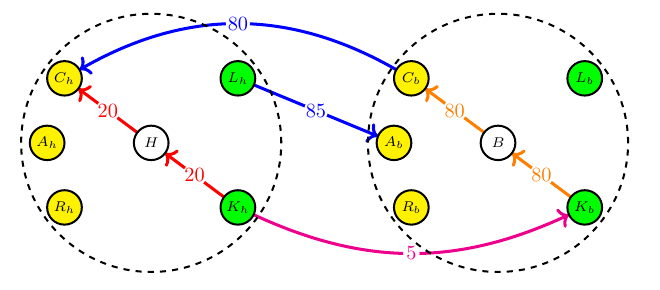
The accounting graph can keep expanding to include all economic entities that engage in transactions and there are well-defined transformations to convert a QEB graph (that represents the entire accounting network) to a set of multiple DEB graphs (the individual accounting systems of entities). Transactions with entities that are not represented directly can continue be modeled as internal transactions. In analogy with the single entity scenario, we can construct the entire accounting network balance sheet.