A Risk Agnostic Approach to European Safe Bonds (ESBies) Tranching
What are European Safe Bonds?
While the creation of the eurozone was a landmark of the European integration process, the financial crisis highlighted that the eurozone remains an incomplete design which can lead to unpredictable and adverse situations in the event of a (the) next major crisis. One of the key such incompleteness features of the current eurozone architecture is that it does not have a truly risk-free (safe) euro debt instrument: one that continues being serviced (avoids a default event) at virtually any point in time and state of the world, no matter how severe.
One of the more prominent proposals to create such safe assets has been the concept of European Safe Bonds (ESBies, Brunnermeier et al 2011 (the Euro-Nomics group). The proposal has been recently updated and supplemented with additional analysis in a European Systemic Risk Board Working Paper (No 21 / September 2016).
According to the proposal, ESBies are the senior tranche of a diversified portfolio of euro area sovereign bonds. A public or private entity (special purpose vehicle) purchases a diversified portfolio of euro area sovereign bonds, weighted according to a strict, well-defined rules, such as euro area countries’ relative GDPs.
The entity issues two types of securities: European Safe Bonds (ESBies) and European Junior Bonds (EJBies). ESBies are senior to EJBies. The tranching point at which the junior tranche is subordinated to the senior tranche is set according to a pre-defined standard. The base case is for the subordination level to be set at 30%. In any case the objective is for ESBies to be at least as safe as the safest euro-denominated assets: currently the AAA-rated sovereign bonds of Germany, the Netherlands and Luxembourg
Risk Assessment Challenges
The proposed structure has a distinct resemblance to a Collateralized Debt Obligation (CDO). A recent memo (How S&P Global Ratings Would Assess European Safe Bonds, April 2017) identified the following two challenges one would face in any methodology that aims to assign a credit rating to ESBies:
- The pool backing ESBies would comprise of only 19 distinct assets (the debt issued by the 19 eurozone sovereigns), hence exhibiting high name concentration
- There is significant default correlation among European sovereign bonds (with evidence for this being the credit
spread and credit rating correlations observed during the euro crisis)
As a consequence of these two characteristics, the S&P research note suggests that the scope for using diversification to reduce risk is significantly narrower for ESBies than for CDOs. Therefore a weak-link approach is suggested as more appropriate for rating ESBies than a CDO approach.
The weak-link approach posits a simplified scenario in which countries will default in strict rating order (with worse ratings defaulting first). Under this approach (and given current ratings) the 30% tranche would attract a BBB- rating ( evidently a far cry from super-safe). Even an increased 40% subordination would still only achieve a slightly better BBB+ rating.
While useful for highlighting the challenges facing any credit analysis of the ESBies, clearly the weak-link approach cannot be used to inform a more in-depth understanding of the structure and its credit risk profile. Under this approach for the ESBies to be AAA rated the subordination would have to be a whopping 80%. This requirement in essence equates the likelihood of a collective joint default of 16 out of 19 eurozone countries - a scenario amounting to the complete wipeout of the European economy - to the default likelihood of a single AAA country.
As another counterexample, imagine all countries converge towards within a [A, AA] rating band (an aspirational target if there ever was one!). In this case the weakest-link method does not produce a AAA rating even with a 100% subordination.
A Risk Agnostic Approach
The design of ESBies versus required subordination may not be driven by the same commercial forces that drove pre-crisis CDO product design. Yet on the face of the previous discussion it seems worthwhile to investigate whether there is a conceptual framework that would allow for a more flexible analysis, including a more helpful estimation of the required subordination for a safe asset status.
We argue that removing the sensitivity to risk models (including e.g current credit ratings) is an interesting alternative approach to the structure of ESBies. After all this is supposed to be a long-term structure that should be able to withstand substantial variation in the future economic fortunes of member countries.
The sensitivity to risk models comes about by two factors. First we have the complexity of assessing the profile of any credit risk portfolio. There are many moving parts (in order of increasing uncertainty):
- The credit risk curves (default likelihoods) of all eurozone countries for many years forward
- The recovery risk in case of default
- The correlations of sovereign defaults (likelihood of joint events) (over e.g., a 5 year period)
- The functional form of the dependency structure (commonly referred to as th applicable copula) especially in the high
stress regime
While this is more or less the type of model risk that plagues any quantitative analysis of credit portfolio risk, in the ESBies case it is made more acute by the second factor: the very small number of entities. Essentially: small variations in key estimates/assumptions can violently shift the risk profile estimate.
Ex-post (once ESBies are issued) such sensitivity could also lead to significant rating instability. Potential future rating instability would also plague the weakest link approach. For example any upgrade to AAA of a major country would induce a huge rating jump.
Luckily we do have a key certainty: the number and the relative size of countries / debt included in the portfolio. Namely
weights = [28.16, 6.61, 0.18, 3.21, 2.02, 21.25, 3.93, 0.03, 0.66,1.80, 0.17, 0.25, 0.07, 0.37, 0.77, 16.52, 1.77, 0.19, 2.01]
What can we deduce from this admittedly very meager data set? We can proceed to develop a risk agnostic approach as follows:
- Recognize that the loss profile is a combinatorial outcome from this finite set of issuers
- Recognize that risk parameters are uncertain when estimated for individual assets, but have a defined range that is based on almost a century worth of empirical evidence
- The functional dependency type of model risk is more esoteric and can be ignored at a first stage
Designing the parametric survey
- Using random draws from 8 Rating Classes spanning a range of default probabilities (in log space) we assign an initial rating to all 19 countries
- Similarly random draws from 5 LGD Classes (corresponding to different levels of loss-given-default in the case of sovereign risk event) assign expected loss given default for each country
- A single factor driving the entire European economy with different countries having parametrized dependency (
correlation) randomly drawn from the 0% to 100% range
For each one of the randomly selected set of parameters (10,000 parameter sets in total) we perform a 5-year forward analysis (simulation) to assess the portfolio loss profile.
We focus on simple measures such as the average loss and its volatility. This helps bypass the fact that very small credit portfolios have discrete loss distributions that do not lend to deriving stable estimates of confidence levels.
Results and Discussion
Distribution of Expected Loss
In the first instance we look at the statistics of the expected loss. This is summarized in the following histogram.
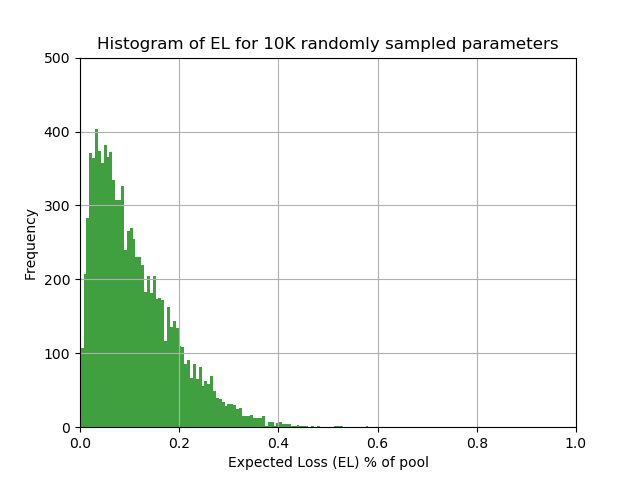
What is the meaning of this diagram? The expected loss of a pool is a deterministic function of the rating and LGD class. This distribution reflects the outcome of the random assignment of ratings and LGD classes to sovereign assets of very different sizes.
(For people familiar with portfolio loss distributions: this is definitely not the loss distribution under different scenarios!)
Distribution of Unexpected Loss
Next we look at the distribution of unexpected losses for different modelling assumptions.
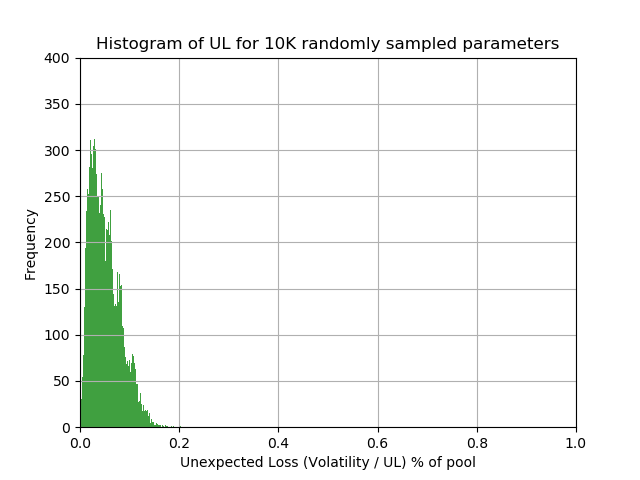
This distribution reflects both PD/LGD uncertainty and correlation uncertainty.
Distribution of Stress Level Loss
As a final step we look at the distribution of stress level losses.
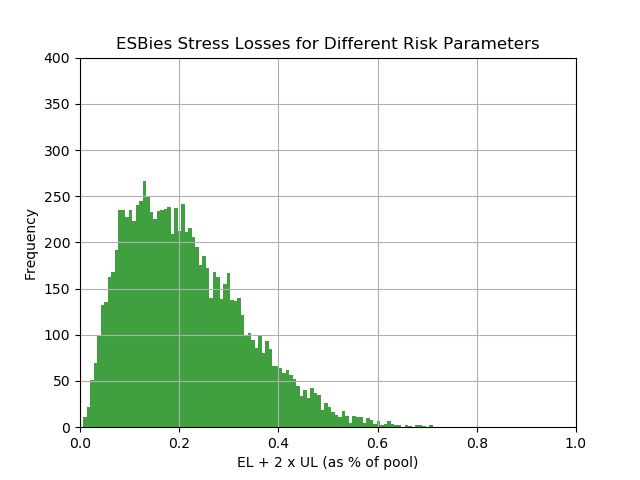
Here we combine the previous two measures as follows: We add a multiple of UL (here we use x 2) to the expected loss to construct a stress level indicator.
Historically this simple approach of adding UL multiples to EL was a way to estimate loss levels for extreme scenarios at a time when more detailed estimates based on simulated distributions were not available. We use it here in a slightly different way: It is namely the answer to the question: What is the distribution of a given stressed loss level due to my parameter uncertainty).
We see that the expected stress loss level is less than 30% (let alone the 80% required for a AAA rating under the weakest-link approach).
In summary, the high risk parameter uncertainty implicit in the analysis of ESBies calls for a more risk agnostic approach. Reducing the dependency on volatile risk estimates (and rating methodologies) is likely to lead to structures that better withstand the test of time. Incidentally, modeling the risk parameter uncertainty (in this post we used a simple uniform prior) eliminates one of the technical difficulties of assessing tail risk for such highly concentrated portfolios.
Obviously, if instead of uniform parameter distributions one assumes different prior distributions (for all or some of the risk parameters) one could inject more realism into the survey, at the expense of accepting more bias / model risk.