IFRS 9 Expected Credit Loss and Risk Capital
The new IFRS 9 financial reporting standard
IFRS 9 (and the closely related CECL) is a brand new financial reporting standard developed and approved by the International Accounting Standards Board (IASB).
Strictly speaking IFRS 9 concerns only the accounting and reporting of financial instruments (e.g. bank loans and similar credit products). Yet the introduction of the IFRS 9 standard has significant repercussions beyond financial reporting, and touches e.g., bank risk management as well. This is prompted by the fact that the framework requires embedding forward looking risk assessments in the measurement of the value of credit assets currently on the balance sheet.
This blog post explains how (in principle) the IFRS 9 machinery implies also an internal risk capital framework which we also illustrate with sample calculations. (This conceptual overlap should not be confused with the more direct numerical impact of loss allowances on available capital!)
Expected Credit Loss
At the core of the IFRS 9 Measurement section is the expected credit loss calculation using scenario averaging of forward losses.
Such expected credit loss must be calculated over the full lifetime of financial instruments (although, under IFRS 9 but not CECL, only so-called Stage 2 assets must be provisioned using the full maturity).
Given the scope of applicability of IFRS 9 there is a vast array of possible implementations of ECL models / estimates. Nevertheless, at least for the larger banking institutions, the recent experience with large scale regulatory stress testing programmes appears to have had an influence in adopting a limited set of macroeconomic scenarios as a key building block.
In turn those macroeconomic factors are affecting the estimates for forward exposures, default rates and losses-given-default (the so-called credit risk parameters).
Lifetime PD Scenarios
As an illustration, we may have derived within the IFRS 9 modeling framework a lifetime PD curve (also credit curve, or term structure of credit risk) as a function of tenor and macroeconomic scenario.
The picture illustrates how the probability of default term structure (used as an input for the ECL and ultimately loss allowance calculation) might shift for different realizations of the macroeconomic scenario.
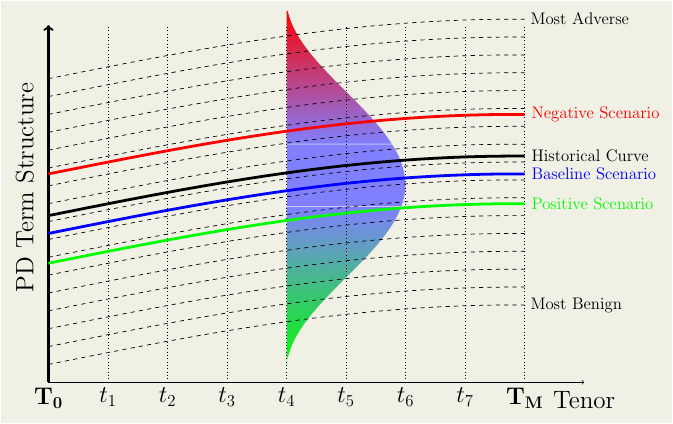
The different realizations of the lifetime PD curve, together with the probabilities attached to the different scenarios (and of course additional information such as LGD etc.) can be used to form an average expected credit loss as required.
What is paramount for the ECL calculation process (and distinctly different from the typical stress testing exercises) is that:
- the probabilities of the different scenarios must be specified explicitly and
- these probabilities must be exhaustive (adding up to 1)
The essence of the link of IFRS 9 with Risk Capital is the existence of a complete set of scenario probabilities. These are not only useful in forming an average loss, but can also help the computation of the variance or volatility of losses
To make the relationship a bit more concrete, lets work through the following example.
Working out a concrete example
Lets imagine that the IFRS 9 ECL calculation (for a certain pool of Stage 2 assets) utilizes three scenarios
-
Positive (Economic Growth) with probability 25%
-
Baseline (Neutral) with probability 47.5%
-
Negative (Adverse or Downturn) with probability 27.5%
Correspondingly, the conditional on each scenario, pool loss rate (over an 8-year period) is calculated to be -
Positive case: 6.8%
-
Baseline case: 20.2%
-
Negative case: 44%
The average expected loss over the lifetime of the pool is then 23.4% The full distribution is implicit and is not be spelled out. But once a set of probabilities / loss pairs are derived, this allows also the calculation of loss variance.
This is illustrated in the next figure where a simulation model with the same expected loss and variance as the IFRS 9 scenario calculation is used to obtain a more fine grained (interpolated and extrapolated) view of the loss distribution.
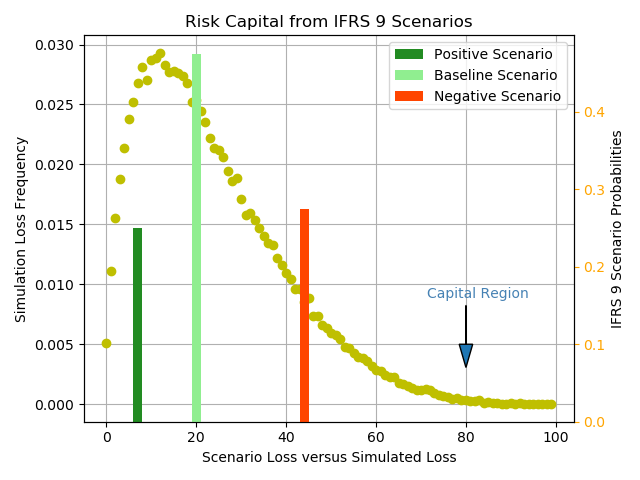
In particular the region to the right of the most adverse scenario would be the region where losses reach a stress level comparable with the available risk capital. As it is fairly intuitive from the figure, estimates in that region must use additional information (for example model assumptions about dependencies).
Discussion
Hopefully this discussion has shown that the conceptual basis for IFRS 9 is actually richer than what might be commonly assumed. While the reported loss allowance estimates will (typically) be far from high stress levels, stressed loss estimates are nevertheless implicit in the averaging process (and hence always available)
Nevertheless in practical implementations there might be a fairly large and varied number of hurdles to overcome:
- The IFRS 9 scenarios might not be probing adequately the highly stressed regime that is relevant for capital considerations. While IFRS 9 guidance specifically requires probing the so-called non-linear regime, the extend and accuracy of such scenarios is critical
- Scenarios geared towards expected loss measurement on a marginal basis may not be capturing adequately dependencies between different risks.
- There might be significant management overlays that are tailored to concrete scenarios and which are not easy to reproduce algorithmically
- While IFRS 9 accounting aims to reduce the differences between accrual book valuation and an economic value approach, differences certainly still remain. The objective of the new standard is not to produce a mark-to-market valuation approach. In other words risk capital estimates based on IFRS 9 scenarios may be underestimating the impact of factors such as market liquidity
- Given the binding nature of regulatory capital there may be a desire to keep internal risk capital assessments actually more aligned with regulatory capital as opposed to economic capital
- There might be system limitations in terms of expanding the functionality of the IFRS 9 framework
- There might be organizational inertia given the different internal functions involved
Those important issues will be the subjects of future posts!
Comment
If you want to comment on this post you can do so on Reddit or alternatively at the Open Risk Commons. Please note that you will need a Reddit or Open Risk Commons account respectively to be able to comment!