Sustainability Is Not a Point It Is a Surface of Possibilities
Sustainability is frequently depicted as an emissions curve to bend, or a temperature threshold not to exceed. A useful visual model is to see sustainability as a surface of possibilities. Achieving environmental objectives still allows widely differing choices that may not all be equally desirable.
Bending the Curve - Sustainability Conceptualized as a One Dimensional Exercise
The opening of the Global Scenario Group report “Bending the Curve: Toward Global Sustainability” by Paul Raskin, Gilberto Gallopin, Pablo Gutman, Al Hammond and Rob Swart, published in 1998 goes as follows:
Over the last few centuries, a mere heartbeat of historic time, humanity has moved to the brink of a new evolutionary milestone - the planetary phase of civilization. The world economy is expanding and becoming more integrated, profoundly reshaping the cultural and political landscape everywhere. This expansion is taking its toll on the natural resources that support development. The human impact on the global environment has grown from diminutive to elephantine. And, despite great wealth in the world, there is still great poverty and suffering. As we drift along the arc of history, we see ahead of us the risk of both greater environmental peril and social friction. We also see the opportunity of a safer passage to a more just and sustainable global society.
The above quote resonates strongly today, with ever larger segments of society. Luckily the sustainability discussion has finally entered the mainstream (though it is nowhere close to an agreed consensus when it comes to any details).
Today it is likely that many more people would recognize the problem of un-sustainability, in both social and environmental dimensions. Yet the depiction of a sustainability as a “target”, a point to reach, which was a potent communication tool back them (an emissions curve that must be bent) has come to dominate how we depict the nature of the sustainability challenge.
It may be wise to expand our visualization toolkit going forward. But let us first review the “Curve Model”.
The Unsustainable Emissions Curve
The famous curve concerns, of-course, the profile of Greenhouse Gas Emissions, namely the seven gases mandated under the Kyoto Protocol to be included in national inventories under the United Nations Framework Convention on Climate Change (UNFCCC). Carbon Dioxide and Methane are the major / well known examples.
The current evidence is that both overall climate and weather patterns are changing on a global scale (and for the long-term) due to human contributions to said Green House Gas Emissions. The result is secular or abrupt changes in environmental conditions (e.g. temperature changes, sea-level changes, wind or precipitation phenomena) that form fundamental risk factors or underlying causes that may generate more specific Climate-Related Risk.
Massive studies by climate scientists of both i) the historical growth of emissions, ii) their impact on climate and iii) the potential mitigation impact of climate adaptation measures and policies lead to the bend the curve visualization.
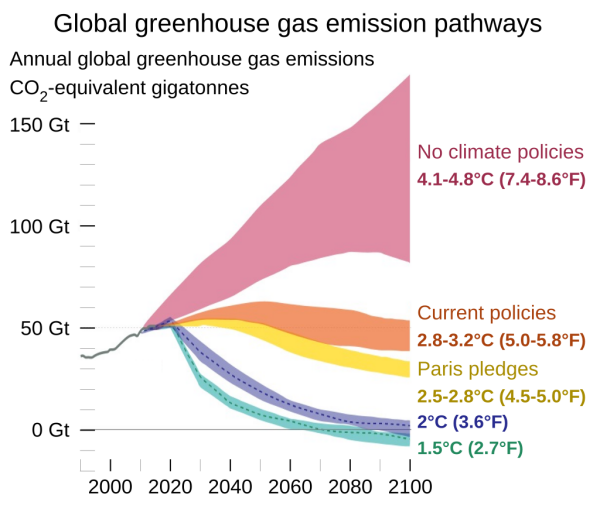
The bend the curve graph (Credit: Wikipedia) packs a lot of information: It connects the growth of emissions in the recent past (the first part of the diagram until the present) with scenarios of the severity and pace of adopted policies, their impact on the volume of emissions (left scale) and, finally, the resulting long-term global average temperature change (right scale). The color-coding of the different curves aims to capture simply the resulting state of the environment (red / hot, or blue / cool).
The power and utility of this diagram is obvious. The extremely complex challenge of adapting global societies and economies to drastically different organizational models is reduced to a simple, digestible, one dimensional metric or performance indicator that aims to answer a simple yes or no question:
Are we taking material enough actions, in a timely enough fashion, to ensure we have a sustainable future?
So far so good, but there are some loose ends in the above conceptual frame and communication tool that might have unintended consequences as we move further into the sustainability transition and its complexities become more apparent:
- The curve ignores many other, non-GHG emissions related, environmental factors (pollution, biodiversity, deforestation) which may have enormous impact on their own and need different sets of policies and targets to be addressed.
- More importantly, it ignores the impact on society of such transformative changes, which may be further aggravated by the political divisions, historical baggage and inequality in the distribution of natural resources, production, consumption and wealth. Sometimes this challenge is denoted as the need for a “Just Transition”.
What would be the right visualization (or at least mental framework) to capture these additional considerations?
The sustainability constraint is a surface in a bigger space
We can start by pointing out that in the one-dimensional curve picture that features “a target point”, sustainability is already a constraint that admits many implicit trajectories. That end point includes actually the space of all possible economies where the range of eventual temperature increase is acceptable. What is not depicted explicitly is the wide range of possible economies and societies that are in principle compatible with a simple temperature constraint and * the dimensions that might differentiate them*.
We are not (as a species) particularly good at visualizing multi-dimensional universes. We can, though, use one additional dimension to illustrate the concept using a (fake) 3D projection:
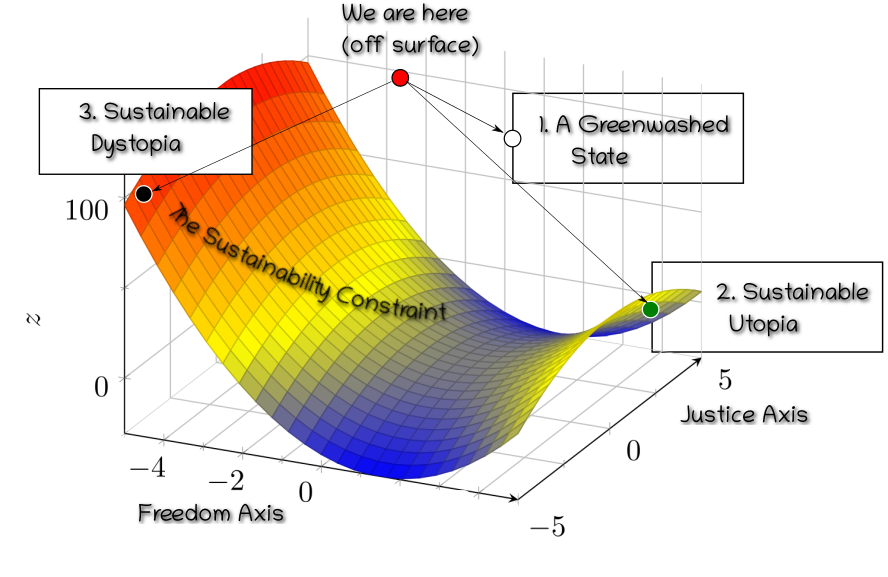
- In the above diagram the state of the global economy at any given time is idealized as a “point”.
- The vertical axis captures environmental strain (defined holistically).
- All points on the colored surface are assumed marginally compatible with the targeted temperature increase.
- Points above the surface are unsustainable, points below are sustainable.
- Currently (red dot) we are “off the surface”, as the transition has barely begun
- There are two dimensions (x, y) that illustrate the type of choices and challenges that determine where on the
sustainability surface we may land:
- E.g. the Justice Axis, which stylizes the fairness of how the risks and losses of the sustainability transition might be allocated
- The Freedom Axis, which stylizes the amount of personal and collective restrictions that might be required in terms of acceptable behaviors and possibilities of action
NB: The choices for what precisely to depict in the three axes are quite flexible. The core concept is that of a surface as boundary.
Greenwashed Scenarios
As a first exercise to develop the intuition about this type of diagram let us consider Greenwashing.
This is defined any form of marketing or other communication / disclosure that uses deceptive means to persuade investors, regulators or the public that an organization’s products, aims and policies or financial instruments are environment friendly. The term was coined by New York environmentalist Jay Westervelt in a 1986 essay. A more recent succinct definition is: The intersection of two company behaviors: poor environmental performance and positive communication about environmental performance.1
Examples of greenwashing abound :
- Missing or misleading factual information (Incompleteness / Errors)
- Claims that are non-material, non-strategic and / or of limited relevance
- Hidden Trade-offs. (See Also Do No Significant Harm Principle)
- Etc.
The cumulative result of greenwashing, assuming that it is pervasive and continues for a material amount of time, is a ( potential) shift in “space” but remaining at a distance from the surface that defines sustainability. The reason being that sustainability is not a question of perception or persuasion but reflects physical / natural constraints and boundaries.
A Sustainable Growth Utopia?
A second very important issue we can explore in this context is the debate of sustainable, Green Growth , or the decoupling of economic growth from adverse environmental footprint.
Critics of green growth highlight how green growth approaches do not fully account for the underlying economic systems change needed in order to address the climate crisis, biodiversity crisis and other environmental degradation. Critics point instead to alternative solutions such as a circular economy, degrowth, doughnut economics or similar fundamental changes which better account for planetary boundaries.
In this post we certainly don’t want to weigh-in in this extremely complex debate. What we want to show is that some level of green growth is definitely possible and in a sense the eventual “mix” is a societal choice rather than an inevitability. This is easier reflected in the richer visualization of a 3D space.
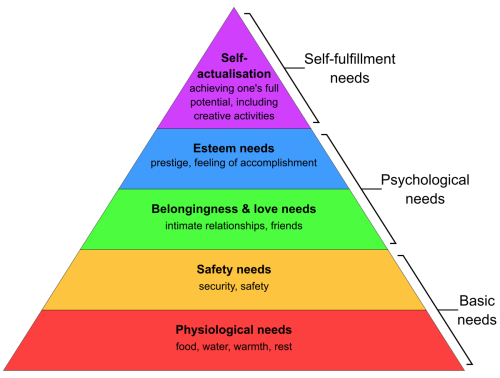
The economy serves needs and the needs of society are diverse and evolving. A stylized (and critised) grouping of such needs is Maslow’s hierarchy of needs. It is most often displayed (Credit: Wikipedia) as a pyramid. The lowest levels of the pyramid are made up of the most basic needs, while the most complex needs are at the top of the pyramid:
- Physiological Needs at the base
- Security and Safety Needs a little higher up
- Social Needs
- Esteem Needs
- Self-Actualization Needs at the very top
We observe some stylized facts:
- the environmental footprint is heavy at lower levels of the hierarchy (food production, water, housing)
- satisfying higher level needs is not predicated on a prescribed material footprint
- modern economies increasingly operate at higher levels of the hierarchy (services)
Extrapolating these stylized facts we can certainly imagine flourishing economies that restructure around an inverted pyramid, where economic activity focuses on serving needs with low-environmental impact and higher position in the pyramid. This is visually depicted as the inverted pyramid of needs, where the width of every level indicates the amount of attention an economy pays.
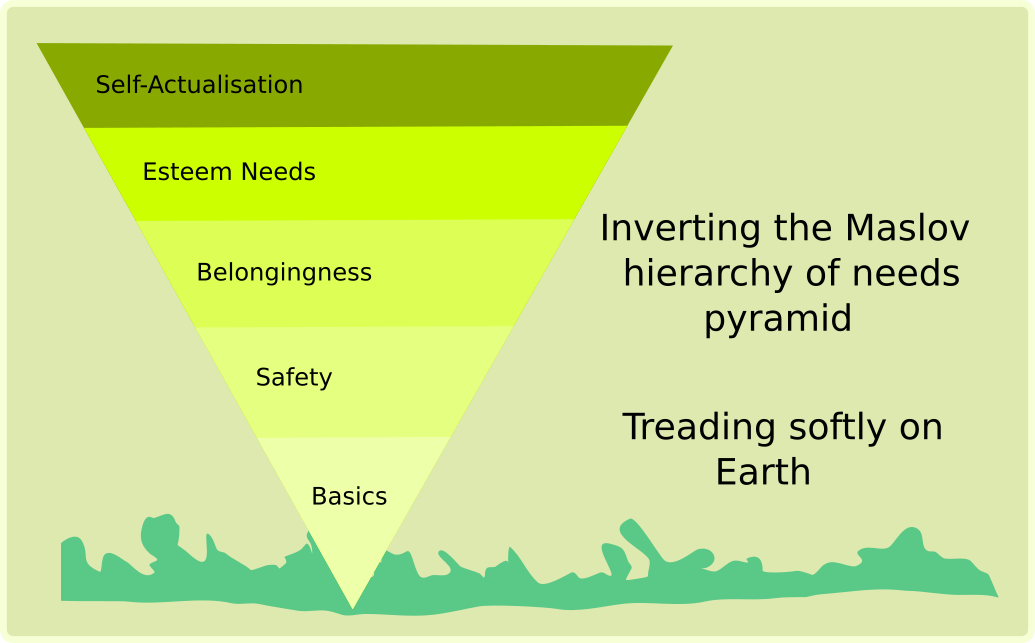
Is such a positive scenario sufficient to provide for “Green Growth”? Whether a sustainable utopia is possible is not clear. The further adoption and utilization of digital technology in innovative ways can certainly expand the role of a digital service economy. For our purposes this range of possibilities simply underpins the notion that “where we land” on the sustainability surface in a “good scenario” (The Green Dot in the Diagram) hides a significant number of choices.
A Sustainable Dystopia?
We are finally ready to discuss an alternative (and dark) scenario that is not commonly discussed but which in the current frame shows up naturally.
Ensuring environmental sustainability is not strongly coupled with any particular social / political arrangement. A-priori a large number of different social and economic configurations may be equally environmentally sustainable. They may widely differ in what freedoms they individuals, what (if any) sense of fairness or justice in how burdens and risks are shared.
A sustainable dystopia scenario may be perfectly within the “correct temperature range” (Black Dot in the Diagram) but outside what we would consider a desirable future.
-
Delmas, M.A., Burbano, V.C., 2011. The Drivers of Greenwashing ↩︎