Why are there so many concentration indices?
We discuss the proliferation of indices and metrics for computing concentration risk (and related diversification and inequality indices). We go over underlying reasons for such proliferation.
Summary
There are dozens upon dozes of indices that aim to measure concentration risk (and related concepts such as diversity or inequality). Why such a proliferation of alternatives? There are multiple reasons, which we will attempt to identify in this post. This enumeration prompts us to dig deeper into the nature of concentration indices and their various pros and cons.
What is even a Concentration Index?
A Concentration Index is any mathematical expression (a function or a formula) that converts a sampled distribution of observed values into a single number that expresses the prevalence (concentration) of certain observations amongst the total.
Mathematically, if $D$ is the sample, a dataset of observations (e.g., a column of numbers) and $F$ is a function, then the index $I$ is a scalar value (e.g. 0.25), that captures something about the distribution.
$$ I = F(D) $$
A concentration index function $I$ applied to data to produce a scalar value is similar to - but distinct - from a sample statistic. The later type of metric are quantities computed from values in a sample that have well defined statistical purpose (estimating a population distribution parameter, describing the sample, or evaluating a hypothesis). The average (or mean) and variance of sample values are the most common such statistics. They clearly do not target concentration aspects.
Concentration indexes are closely related to inequality indexes in economics and diversity indexes in biology. In these alternative contexts inequality is interpreted as a concentration of, e.g., wealth or income. Correspondingly, diversity is seen as the absence of dominant (concentrated) species.
A simple first question to ask is: what would be a rough number for all the available indices? The answer is, nobody knows, and most likely it is infinite! Nevertheless we will look into the most commonly referenced examples.
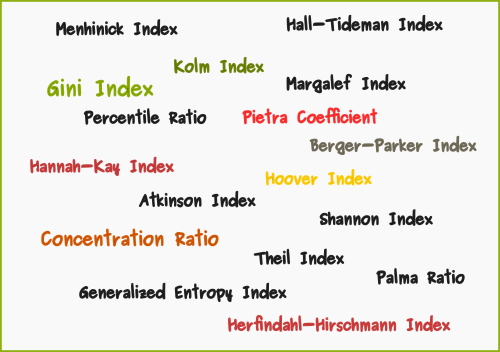
When looking at the word cloud below that lists a (non-exhaustive!) collection of such indices, one might immediately single out an index their are familiar width (e.g. the Herfindahl-Hirschmann or HHI index) but blank out at the many other colorful names.
Reason 1: Invented separately in many distinct domains
Measuring some form of concentration in a system with many elements occurs in so many disparate knowledge domains. This creates dozens upon dozens of different definitions, many of which are not necessarily independent from each other or truly distinct.
For example income inequality may be measured by dozens of different indices. Many of them, such as the Atkinson Index or the Theil Index are also applicable and are used in completely different domains. Since various concentration metrics were (re)discovered in different domains it would take a substantial cross-disciplinary search to get a comprehensive view of all existing proposed.
To further support the argument that concentration indices are proliferating due to the many distinct domains that make use of them, let us list indicatively some important domains. In all of these concentration indices are an important part of the quantitative toolkit:
- When Regulating Market Structures. This entails assessing the degree to which a market might be too concentrated , that is dominated by a few entities, leading to phenomena such as oligopoly, oligopsony etc.
- In Financial Risk Management. A typical task in Financial Risk Management is measuring the concentration of certain risks in financial portfolios, whether those are portfolios of securities (market instruments), lending portfolios etc.
- In Welfare Economics various income inequality metrics aid the measurement (and informing policy decisions) around wealth and income concentration.
- In Ecology, measuring Biodiversity in its various forms (taxonomic, ecosystem, functional).
- In Chemistry, concentration measures the abundance of a constituent divided by the total volume of a mixture. Several types of mathematical description can be distinguished: mass concentration, molar concentration, number concentration, and volume concentration
- In Economic Geography, Geographical segregation measure whenever the proportions of population rates of two or more populations are not homogeneous throughout a defined space
As we can see in the above enumeration, these domains do not have much in common. An important underlying commonality exists, though: All these domains concern aspects of the human economy or chemical/biological ecosystems that are characterised as systems with populations having measurable characteristics. In each case one aims to construct useful summary indicators about how some attribute of an individual entity within the broader system is distributed among the members of the population.
With the knowledge that we start with a diverse field (pun), let us examine further reasons for the profusion of indices. Some are more justified than others!
Reason 2: Multiple names for essentially the same Index
Sometimes it is simply a different name that distinguishes indices that are otherwise identical. Two indices will be identical they are defined by the same formula $F$ and (obviously) produce the same outcome for the same input.
The use of different name might trace back to the first widely popularized use (e.g. the name of an author). Indices that come under different names but are identical can be identified by simply checking their defining formula.
For example, the Berger-Parker Index is a special case of the Concentration Ratio . It is the fraction of the population formed by the most abundant category ($k=1$ in the relevant notation).
In some instances otherwise effectively identical indices may have slight definitional differences. These can be different normalizations or scaling that change the range of the index.
In such cases it means that it might be possible to convert one index to the other by simple numerical operations such as multiplication or inversion. Or vice versa, genuinely different indices will in general not have an easy method for obtaining one from the other.
A good example comes from the variety of entropy based indices that fundamentally all use the formula (where $w$ are the weights of the distribution):
$$ T = \sum^{n}_{i=1} w_i \log{w_i} $$
The Theil Index $T$ index is the Shannon index (Or Shannon-Wiener Index) with a sign reversal.
Another example is the Simpson Index which is the 1 minus the HHI index, and the Inverse Simpson Index which is simply the inverse of the HHI index.
Reason 3: Generalized Families of Indexes
Several of the most heavily used indices (HHI, Entropy) have over the course of time received intense scrutiny and non-trivial generalizations. These usually bear the name of the seminal paper authors.
For example we can think of the Hannah Kay Index as a generalization of the HHI index (which is a special case for $a=2$).
$$ HK_a = \begin{cases} (\sum_{i=1}^{N} w_i^{a}) ^{1/(1-a)} & \mbox{for}\ 0 \leq a \neq 1 \\ e^{\left(\sum_{i=1}^{N} w_i \log w_{i}\right)} & \mbox{for}\ a=1, \end{cases} $$
Given such parametric families where each choice of $a$ produces a distinct index we see that the existence of infinite numbers of indices is not a figure of speech. Of course in practice very few of these variations will be used.
Reason 4: The nature of the underlying data
Different indices might be required when applied to different types of quantitative data. Population data of distinctly different nature to which one might try to apply such indices may be:
- Categorical Data , where measured values range along a finite number of possible values (which might not even have an intrinsic order).
- Numerical Data (integer or real variables)
- Spatial Data that make explicit use of geographical (numerical) coordinates.
- Graph (Network) Data that involve connections between population members.
While some indices can be applied across different data categories, this is not always so. In a White Paper we explore in some detail data types representing economic network data and their statistical nature which is critical in their use in concentration analysis. We recast various known indexes drawn from distinct disciplines in a unified computational context.
Further, while the typical focus is on mapping a univariate distribution to a scalar, but there are use cases where one must consider a bivariate distribution (Bivariate Indices ).
Reason 5: Distinct meaning and usability
Finally, the most profound reason why many different concentration indices exist is that they may mean different things. In other words, they capture different aspects of concentration.
Concentration indices fundamentally distill different aspects of complex, multidimensional distributions. Depending on the use context - which as we saw is very diverse, if the existing suite of indices is not found to adequately highlight the aspects the researcher or analyst have in their focus it is relatively easy to develop more adapted alternatives.
In general we would want that our concentration metrics satisfy some quality criteria that would ensure their suitability for risk management. For example the index should be:
- objective, well defined and reproducible
- consistent across time
- sufficiently sensitive to changes in concentration
- applicable across different portfolios and different firms
While the list of desired properties is a reasonable expectation, we might want to require that the concentration metrics always satisfy a set of logical criteria that one would intuitively expect from a concentration index.
For example it makes sense that removing the largest exposure should always reduce the concentration index. A list of such logical requirements that has been proposed in the literature is:
- If two or more exposures are merged, the index must not decrease
- The concentration index reaches its minimum value, when all exposures are of equal size
- The concentration index must not increase with an increase in the number of uniformly small exposures
- The simultaneous reduction of one exposure and equal increase of a larger exposure should not decrease the concentration index
- Introducing an additional exposure of a relatively low size does not increase the concentration index
In the Open Risk Academy Course Introduction to Credit Concentration we discuss these principles in more concrete use cases.