Is Global Debt Truly Astronomical?
Is Global Debt Truly Astronomical?
Is the size of global debt truly “astronomical”?
The notion of astronomical numbers and figures is quite frequently seeping in everyday language when large quantities of something are encountered in “normal” life. The strict definition of astronomical is obviously something of, or relating to, astronomy and astronomical observations but in common usage it also denotes something enormously or inconceivably large. This is, of course, because astronomical figures are inconceivably large!
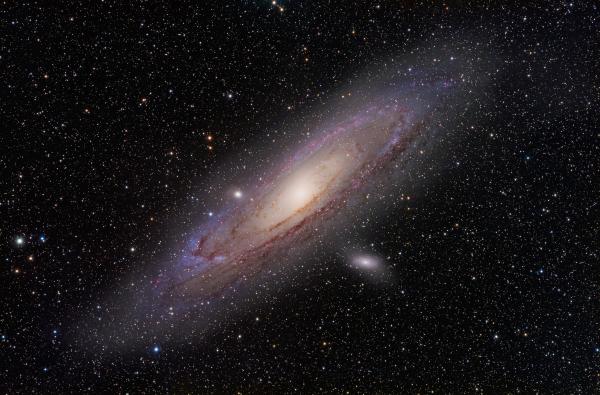
How large is large? Well, you can pick your favorite example from Wikipedia’s Orders of Magnitude ladder or consider for example that the distance to the nearest large Galaxy is 2.5 million light years. Suffice it say that the sizes of astronomical objects are such that it is not even practical to use our common counting systems. Astronomers are using shorthands (such as a light year = 9.46 trillion kilometres!) and/or so-called scientific notation.
Scientific notation, roughly speaking, focuses on capturing the number of zeros in a number as for very large numbers that is the most important attribute. We don’t really need to go into scientific notation here, but some examples set the scene for the type of number we will be discussing:
$\mbox{1 Million} = 10^6$, needs six (+ one) digits to describe fully
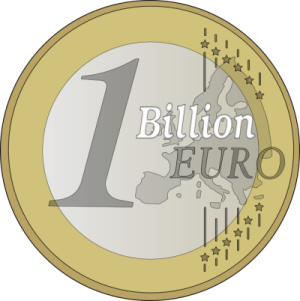
$\mbox{1 Billion} = 10^9$, needs nine (+ one) digits
$\mbox{1 Trillion} = 10^{12}$, needs twelve (+ one) digits
$\mbox{1 Quadrillion} = 10^{15}$, etc, you get the pattern.
In this post we will ask (and answer) the critical question:
Is the Global Debt truly astronomical?
NB: this is meant to be a fun and entertaining commentary, but also factually accurate - at least within an astronomical order of magnitude! Above all, it is hopefully instructive and educational!
How much is the Global Debt?
To answer whether astronomic is an appropriate characterisation we first need to get a figure (number) for the global debt. If you search for global debt you will find plenty of sources for such quantitative information, with various degrees of granularity, recency and scope. For the needs of this commentary we will go with a recent (as of December 2020) $277 trillion figure of the Institute of International Finance (this is actually a forecast for 2020 year end, as reported by Reuters).
We will not dig into further details on the makeup of that debt. A trillion here, a trillion there, does not really make a difference to our task! What is important for our purposes is the rough meaning of such debt: it is the sum total of the monetary value, converted into one common unit of measure, namely dollars, of all material outstanding credit contracts on the planet. In other words, it is the sum of explicit “I-Owe-You” agreements between entities, independently of whether these entities are individuals, companies or sovereigns.
Making debt tangible
Now, most reasonable people would agree that $277 trillion is a large number. In fact, it seems unfathomably large. It is the number 277 followed by twelve zeros. That is a lot of zeros. In scientific notation:
$\mbox{Global Debt} = 277 \times 10^{12}$
Impressive, but is this number actually astronomical?
To make progress we need to assign a physical scale to debt because it is the length and temporal scales that define astronomical phenomena. We will do this indirectly, by assigning a physical scale to money. Is that a legitimate association? Well, yes. Not only is there a Credit Theory of Money, whatever you think of the true nature of money, debt is expressed in monetary units, so using money as a proxy seems like a good start.
Of course debt has many, many other attributes that money doesn’t have. For example, the debt maturity, the time by which the paid must be repaid. Or the interest rate, another important debt feature (although the current convention is to set this rate, for simplicity, to zero).
What would be a reasonable choice to represent “money” as a physical realization? Luckily in the history of monetary systems there have been concrete examples of so-called Commodity Money. In the commodity theory of money, monetary value derives from the commodity of which money is made. This use invariably imparts a length scale to monetary artefacts as commodities are physical objects. This scale is, roughly, matching the human body scale, which makes sense, given the need to store, handle, transport and exchange money.
What type of money is transportable or not has a cultural component too. For example, the Axe-like grzywnas from Kostkowice, Poland were used as money in the 9th to mid-10th century AD.

In any case, ever since the fateful Chinese invention of paper money in the 11th century, the physical manifestation of money has been a banknote. There is an enormously colorful variety of banknotes that have been printed over the years, but it seems fair to see that at least for our present purposes, you have seen one, you have seen them all. In this spirit, this is the specimen that we choose to work with:
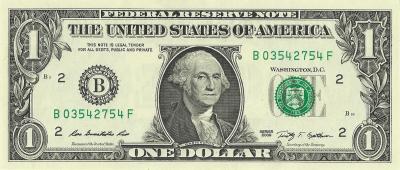
Dimensions:     Meters      Millimeters
Width:      0.16     156.10
Height:      0.07     66.30
Before we proceed, though, we need to preempt a valid criticism. Why use a unit dollar bill in preference ot another denomination? Paper money (but also metallic versions) are evidently flexible enough to represent a wide range of value.
The justification comes, roughly speaking, from the same set of considerations that determine the value of lowest denomination banknote, it is namely a sort of unit of smallest possible economically meaningful exchange.
How many dollars to reach the Moon?
We are now ready to get down to business. Courtesy of Wikipedia we have the following astronomical figures:
Object              Size In kilometers
- - - - - - - - - - - - - - - - - - - -
Moon Radius         1,736
Earth Radius     6,357
Earth-Moon Distance 384,402
It is now a matter of simple division to obtain the number of dollar bills required to reach the moon, namely: 2,462,536,835 pieces. Notice that we use the wide side of the dollar bill, in order to save on material.
Visually, reaching the Moon using a stairway made of dollar bills looks as follows:
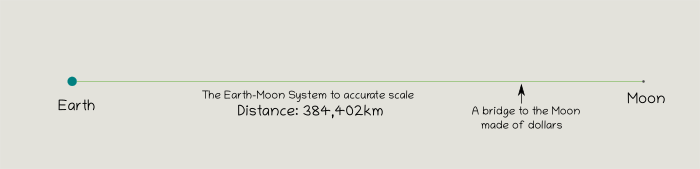
The above visual is to scale. This means that the distance of the Moon from the Earth, and the radii of the two bodies are faithful to their actual proportions. BTW, if you are not surprised by this image you are either i) an astronomer or ii) do not really appreciate how special our Moon is compared to typical moons (with small m). It is actually very large versus our planet. You can see this clearly in this stunning image from the DSCOVR satellite.
In any case, we have our first important benchmark:
If you want to pave your way to the Moon with dollar bills, it will set you back a cool 2.5 billion. According to some speculation a future SpaceX trip will only cost around 90 million, obviously a bargain.
A single line of dollars stretching from our planet to the nearest astronomical body is certainly impressive but does it count as an astronomical artifact? Not really, as this line is only 0.07 meters thick, hence would be completely invisible in the darkness of space. But we’ve only used up 2.5 billions of the 277 trillion planetary debt. What if we place side-by-side multiple lines of dollar bills stretching along the same direction? So let’s continue with the number crunching!
It turns out there are precisely 112,486 such lines (worth 2.5 billion each) that fit within the global debt pile of $ 277 trillion. If we place them side by side, the width of that column is about 7.5 km.
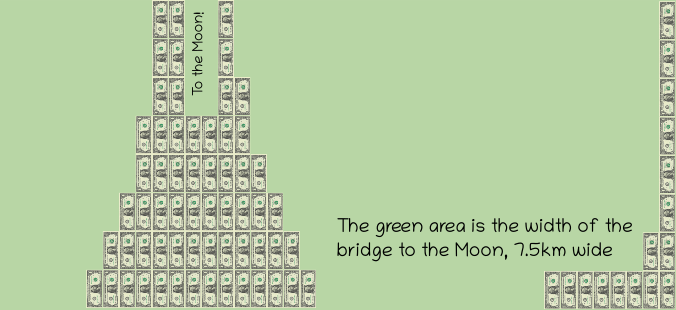
That is a fairly wide (and certainly extremely tall) wall of dollars - as it reaches all the way to the Moon.
To get a better visual impression of overall scale we can put it next to a visual of a cityscape. Given that the tallest building is still short of one kilometer, the base of this stairway to the Moon placed against a familiar architecture would look as follows:
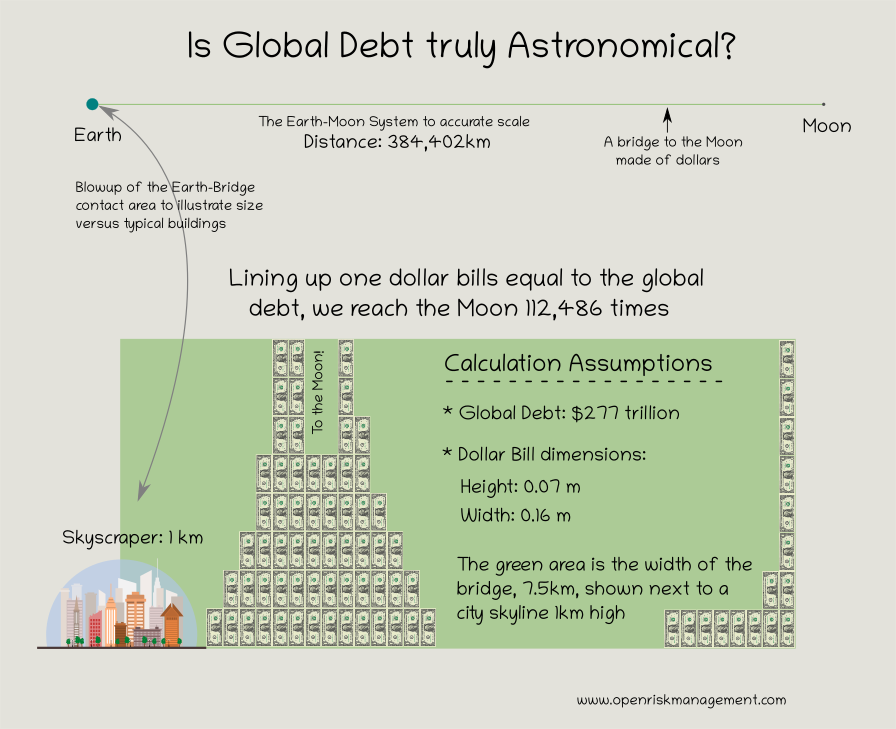
We finally have a visual image for the scale of the global debt in the form of a wall of dollars that is many kilometers wide and reaches all the way to the Moon!
But! Is this wall of astronomical proportions? Not quite. 7.5 km is not really an astronomic size any more than the width of single dollar bill. Our expensive stairway to the Moon would quickly disappear from sight if we drifted away from it towards any astronomically relevant distance. Time for some creative thinking…
What if we choose not to go to the Moon but rather cover the Earth with dollar bills equivalent to global debt?
Is the Global Debt visible from space?
The Great Wall of China, often cited as the only human-made structure visible from space, is not visible from low Earth orbit without magnification, and even then can be seen only under perfect conditions. The Wikipedia article discusses this topic, Artificial structures visible from space and makes it quite clear that the answer depends on the distance, the instrument used, and the viewing conditions.
Let’s get number crunching again:
Object              Size In Meters
- - - - - - - - - - - - - - - - - - - -
Earth Perimeter              40,007,863
Earth Half-Perimeter      20,003,932
Bills Wrapped around Equator 256,296,368
Total Number of Required Wraps 1,080,780
Width of Debt Zone          71,656
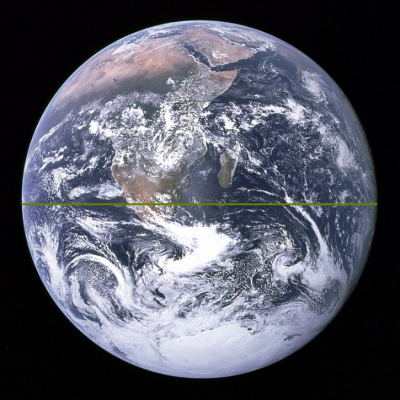
Hence, our wall of debt is now converted into a belt of debt, that is almost 72 kilometers wide, wrapping Earth at the Equator more than a million times. If we imagine looking at this structure from space, e.g., the iconic “Blue Marble” photo taken by Apollo 17 then its size will be about 3 pixels wide:
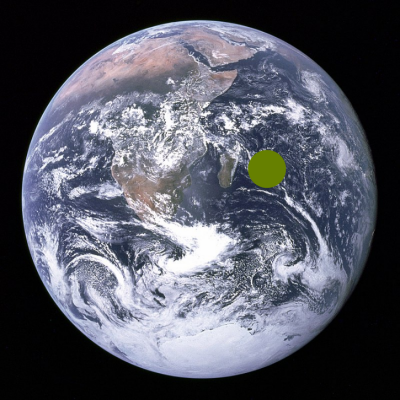
This is a little more convincing but not quite the “aha” moment. What if we collect all the debt in one place as it were, lay our debt dollars in one circular region? Back to the spreadsheet:
Object              Size In Meters
- - - - - - - - - - - - - - - - - - - -
Surface Area  2,866,792,110,000
Radius          955,263
Diameter      1,910,527
The diameter of such a disk would be 76 pixels on the same image:
We have reached the glorious conclusion that Global Debt is indeed astronomical in size: If we represent planetary debt using a common and tangible representation of monetary value it would be easily visible from space!
Incidentally this is also (in a roundabout way) an illustration of how human economies have now truly a planetary footprint. There is a slow but accelerating realization that Sustainable Finance will be an extremely important consideration going forward.
Before we close, worth mentioning two interesting and important questions:
Is the astronomical size of debt really a problem?
This is an entirely different question and one to which trivial astronomical calculations are, alas, unlikely to shed any light.
The sustainability of debt systems depends on many factors and is, even after repeated crises not completely understood. Debts are claims of fixed size, embedded in economies with a wide variety of assets, some more tangible than others. Credit crises happen, for example, when the universe of assets on which debt is based turns out to be less than what it was imagined to be. The conditions under which that happens are diverse and not always easy to assess ahead of time. Is it a credit bubble or is it simply the next stage in economic development? Or is it maybe a revolution that is wrapped in a bubble?
Using various ratios that capture stylized facts about economic systems (e.g., Debt to GDP) is an important exercise and provides some insights. The use of such ratios immediately “normalizes” nominal values. The (large) debt number is divided by some equally large number representing economic activity at various levels. For example just the global public equity markets are valued at around $85 trillion in 2020, a number that is of the same order of magnitude as the global debt.
After the Great Financial Crisis there has been no shortage of research and analyses into what causes crises, see e.g.1
In retrospect, after a crisis, the level of debt is easy to assess as having been *too much* for the economy that generated it. The same assessment *ahead of a crisis* is not at all easy!
What happens when money becomes wholly digital without any tangible aspect?
We established that global debt has, in a sense, astronomic proportions and that is it not at all clear whether that is a problem or not. Now is time to step back and ask in what sense (if any) the question the physical size of money is important at all.
The difficulty or not of manipulating money has long been understood to have behavioural implications. Infamous is the motivation for the so-called iron money of ancient Sparta. Plutarch is the most explicit source about this. In his Life of Lycurgus he tells us that: 2
As we are currently witnessing an accelerated transition to entirely digital economies the implications and behavioral changes could be quite systemic. A study by the Dutch Central Bank suggests that3:
Will the complete digitization of economies aggravate volatility and financial crises by making financial figures ever more abstract and detached from physical manifestations of the economy? Only time will tell…
-
Financial Crises : Causes, Consequences, and Policy Responses, Stijn Claessens, Ayhan Kose, Luc Laeven, and Fabian Valencia, IMF, February 2014 ↩︎
-
H.Michell, The Iron Money of Sparta, Phoenix, Vol. 1, Supplement to Volume One, Spring, 1947, pp. 42-44 ↩︎
-
Frank van der Horst and Ester Matthijsen, The irrationality of payment behaviour, DNB Occasional Studies 2013 ↩︎
Comment
If you want to comment on this post you can do so on Reddit or alternatively at the Open Risk Commons. Please note that you will need a Reddit or Open Risk Commons account respectively to be able to comment!