A Global Mobility Index
We introduce a global mobility index that averages Google mobility data across all available countries (weighting by population) to provide an overall view of how the pandemic has influenced human mobility
Constructing a Global Mobility Index (GMI)
In previous posts (here, and here) we introduced new Open Risk Dashboard functionalities that integrate COVID-19 community mobility data (currently focusing on the datasets provided by Google).
As a reminder, these reports chart over time human mobility trends collected from mobile geolocation data. The granularity is by geography and across different categories of places / activities such as retail and recreation areas, groceries and pharmacies, parks, transit stations, workplaces, and residential areas. Through these data sets we have available (for the first time in history) an overall quantitative view of global mobility (and Mobility Risk )!
The dataset provides mobility insights at various levels of granularity. It is quite large already (as of Dec 8 2020 it exceeds the three million observations). This abundance of data makes it quite difficult to get an overall view of what is happening. The best high level summaries that are available within the dataset are in the form of country level summaries (averaging mobility across a country’s territory)
There are currently circa 130 countries represented in the data but not all of them present data points for all the mobility categories and all timepoints. The objective of the Global Mobility Index we construct here is to derive a summary metric of global mobility, using country level data and weighting by population.
A brief refresher of the data structure
Before we embark on constructing the global mobility index, a brief reminder about the main mobility / activity categories being tracked:
- Retail and Recreation: restaurants, cafes, shopping centers, theme parks, museums, libraries, and movie theaters
- Grocery and Pharmacy: grocery markets, food warehouses, farmers markets, specialty food shops, drug stores, and pharmacies
- Parks: local parks, national parks, public beaches, marinas, dog parks, plazas, and public gardens
- Transit Stations: public transport hubs such as subway, bus, and train stations
- Workplaces: places of work
- Residential: places of residence
The datasets show how visits and length of stay at different places change compared to a baseline. The baseline measurement is individual per dataseries.
Mobility Indexes Per Category
We construct an index per category by weighted average of the country level indexes. For example, if $\mbox{RR}_i$ is the Retail and Recreation index for the different countries $i$, then
$ \mbox{GMI(RR)} = \sum_{i} w_i \mbox{RR}_i$
where $w_i$ is the population weighted contribution of a country to this particular index (not all countries have data). A further transformation we perform is a temporal average the country level data over weekly (sever day periods). This is done to remove the significant noise of intra-week mobility that is seen on many dataseries.
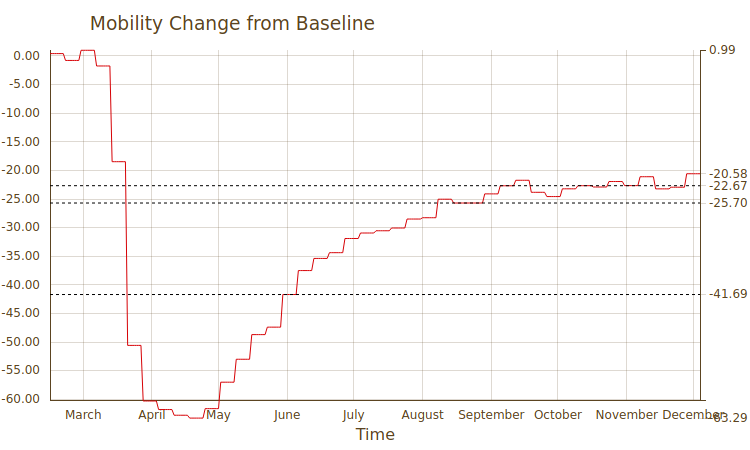
With the above processing we get a global mobility index per activity. For example the Retail and Recreation Index looks as follows:
Live versions of these mobility indexes are available at the Dashboard:
- Global Retail and Recreation Mobility
- Global Grocery and Pharmacy Mobility
- Global Parks Mobility
- Global Transit Stations Mobility
- Global Workplaces Mobility
- Global Residential Mobility
Comparing mobility data across countries is a very approximate exercise as large behavioral and definitional differences may exist between countries. Hence this analysis should be only seen as a high level, directional overview!
Combining all activity measurements into a single global index
In the previous step of the exercise we averaged indexes across different regions to get an index per activity. One further step we can pursue is to compute a global average by summing across all types of activity $k$.
$ \mbox{GMI} = \sum_{k} \frac{1}{6} \mbox{GMI(k)}$
Nota Bene: This summing is more tenuous than our previous country-level averaging. In principle mobility measurements can be aggregated in a theoretically “correct” manner but this likely requires going back to low level data, before those are classified to categories. Nevertheless, the GMI still satisfies some important properties:
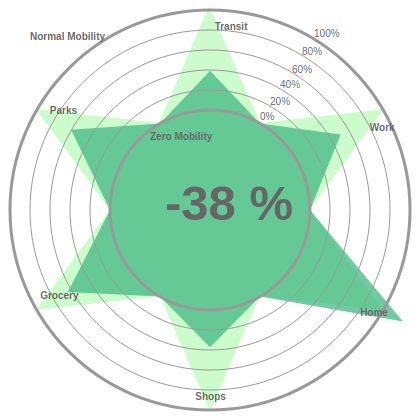
The GMI index goes to 0% when mobility is back to *normal*, and it goes to -100% when mobility (for all measured categories) is reduced to zero.
Visually we can put the six indexes and the global average together as a star diagram. The light green start in the background represents 0% decline from normal (regular mobility). The reading of -38% global mobility is the worst reading during the pandemic. The current total is circa -10%.
A live version of this visual that can be used to check different time periods is available here
Further Insights and Work
The Mobility Data module at OpenCPM is free and open to explore. Feel free to explore and if you have any suggestions / ideas for further functionality get in touch! In the live server version of indexes you can also hover over the data and read out index values at specific timepoints
Appendix: GMI Country Weights
We include here for reference the weights used for the construction of the GMI:
| Country | Population (mln) | Weight |
|---|---|---|
| United Arab Emirates | 9.4 | 0.002 |
| Afghanistan | 0.0 | 0.000 |
| Antigua and Barbuda | 0.0 | 0.000 |
| Angola | 29.8 | 0.006 |
| Argentina | 44.9 | 0.008 |
| Austria | 8.8 | 0.002 |
| Australia | 24.5 | 0.005 |
| Bosnia and Herzegovina | 3.5 | 0.001 |
| Barbados | 0.0 | 0.000 |
| Bangladesh | 164.7 | 0.031 |
| Belgium | 11.4 | 0.002 |
| Burkina Faso | 0.0 | 0.000 |
| Bulgaria | 7.0 | 0.001 |
| Bahrain | 1.5 | 0.000 |
| Benin | 0.0 | 0.000 |
| Bolivia | 11.1 | 0.002 |
| Brazil | 210.1 | 0.040 |
| The Bahamas | 0.4 | 0.000 |
| Botswana | 0.0 | 0.000 |
| Belarus | 9.4 | 0.002 |
| Belize | 0.0 | 0.000 |
| Canada | 37.9 | 0.007 |
| Switzerland | 8.5 | 0.002 |
| Côte d'Ivoire | 24.3 | 0.005 |
| Chile | 18.1 | 0.003 |
| Cameroon | 24.1 | 0.005 |
| Colombia | 49.1 | 0.009 |
| Costa Rica | 4.9 | 0.001 |
| Cape Verde | 0.0 | 0.000 |
| Czechia | 10.7 | 0.002 |
| Germany | 83.1 | 0.016 |
| Denmark | 5.8 | 0.001 |
| Dominican Republic | 10.4 | 0.002 |
| Ecuador | 16.6 | 0.003 |
| Estonia | 1.3 | 0.000 |
| Egypt | 94.8 | 0.018 |
| Spain | 46.7 | 0.009 |
| Finland | 5.5 | 0.001 |
| Fiji | 0.0 | 0.000 |
| France | 66.6 | 0.013 |
| Gabon | 0.0 | 0.000 |
| United Kingdom | 66.0 | 0.012 |
| Georgia | 3.7 | 0.001 |
| Ghana | 26.9 | 0.005 |
| Greece | 10.8 | 0.002 |
| Guatemala | 17.3 | 0.003 |
| Guinea-Bissau | 0.0 | 0.000 |
| Honduras | 9.3 | 0.002 |
| Croatia | 4.1 | 0.001 |
| Haiti | 0.0 | 0.000 |
| Hungary | 9.8 | 0.002 |
| Indonesia | 264.0 | 0.050 |
| Ireland | 4.8 | 0.001 |
| Israel | 9.1 | 0.002 |
| India | 1326.1 | 0.250 |
| Iraq | 38.3 | 0.007 |
| Italy | 60.3 | 0.011 |
| Jamaica | 2.9 | 0.001 |
| Jordan | 10.4 | 0.002 |
| Japan | 126.8 | 0.024 |
| Kenya | 48.5 | 0.009 |
| Kyrgyzstan | 6.2 | 0.001 |
| Cambodia | 16.0 | 0.003 |
| South Korea | 51.5 | 0.010 |
| Kuwait | 4.6 | 0.001 |
| Kazakhstan | 18.3 | 0.003 |
| Laos | 6.9 | 0.001 |
| Lebanon | 6.1 | 0.001 |
| Liechtenstein | 0.0 | 0.000 |
| Sri Lanka | 21.4 | 0.004 |
| Lithuania | 2.8 | 0.001 |
| Luxembourg | 0.6 | 0.000 |
| Latvia | 1.9 | 0.000 |
| Libya | 6.7 | 0.001 |
| Morocco | 36.0 | 0.007 |
| Moldova | 2.6 | 0.000 |
| North Macedonia | 2.1 | 0.000 |
| Mali | 0.0 | 0.000 |
| Myanmar (Burma) | 53.4 | 0.010 |
| Mongolia | 0.0 | 0.000 |
| Malta | 0.5 | 0.000 |
| Mauritius | 1.3 | 0.000 |
| Mexico | 130.5 | 0.025 |
| Malaysia | 31.6 | 0.006 |
| Mozambique | 29.7 | 0.006 |
| Namibia | 2.5 | 0.000 |
| Niger | 0.0 | 0.000 |
| Nigeria | 190.9 | 0.036 |
| Nicaragua | 6.2 | 0.001 |
| Netherlands | 17.1 | 0.003 |
| Norway | 5.4 | 0.001 |
| Nepal | 29.4 | 0.006 |
| New Zealand | 4.9 | 0.001 |
| Oman | 4.8 | 0.001 |
| Panama | 4.1 | 0.001 |
| Peru | 29.4 | 0.006 |
| Papua New Guinea | 0.0 | 0.000 |
| Philippines | 101.0 | 0.019 |
| Pakistan | 216.6 | 0.041 |
| Poland | 38.4 | 0.007 |
| Portugal | 10.6 | 0.002 |
| Paraguay | 6.8 | 0.001 |
| Qatar | 2.6 | 0.000 |
| Romania | 19.6 | 0.004 |
| Serbia | 7.0 | 0.001 |
| Russian Federation | 146.8 | 0.028 |
| Rwanda | 0.0 | 0.000 |
| Saudi Arabia | 33.0 | 0.006 |
| Sweden | 10.4 | 0.002 |
| Singapore | 5.9 | 0.001 |
| Slovenia | 2.1 | 0.000 |
| Slovakia | 5.4 | 0.001 |
| Senegal | 15.9 | 0.003 |
| El Salvador | 6.4 | 0.001 |
| Togo | 7.8 | 0.001 |
| Thailand | 65.9 | 0.012 |
| Tajikistan | 8.9 | 0.002 |
| Turkey | 82.0 | 0.015 |
| Trinidad and Tobago | 1.4 | 0.000 |
| Tanzania | 57.3 | 0.011 |
| Ukraine | 42.6 | 0.008 |
| Uganda | 42.9 | 0.008 |
| United States | 328.2 | 0.062 |
| Uruguay | 3.5 | 0.001 |
| Venezuela | 28.5 | 0.005 |
| Vietnam | 94.7 | 0.018 |
| Yemen | 0.0 | 0.000 |
| South Africa | 59.6 | 0.011 |
| Zambia | 17.1 | 0.003 |
| Zimbabwe | 16.5 | 0.003 |
Comment
If you want to comment on this post you can do so on Reddit or alternatively at the Open Risk Commons. Please note that you will need a Reddit or Open Risk Commons account respectively to be able to comment!