Open Risk Data

Mathematical Representations of Credit Portfolio Data

Mathematical Representations of Credit Portfolio Data

What do we mean by credit data? This post is a discussion around mathematical terminology and concepts that are useful in the context of working with credit data, taking us from network graph representations of credit systems to commonly used reference data sets

Reading Time: 27 min.
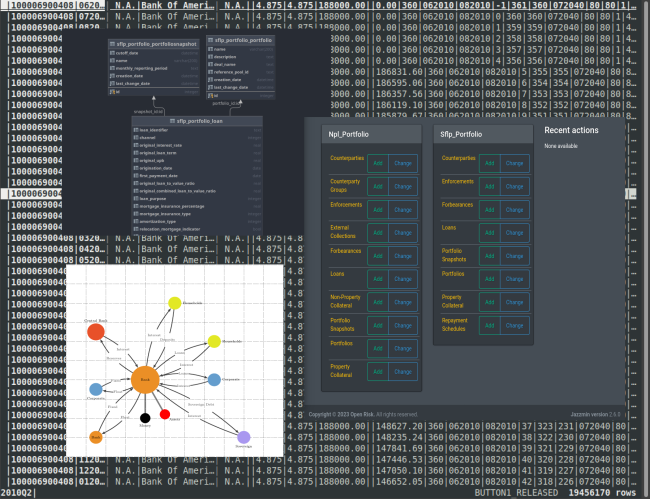
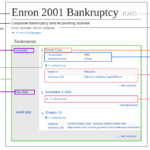
Definition of Credit Data What do we mean by credit data? For our purposes Credit Data is any well-defined dataset that has direct applications in the assessment of the Credit Risk of an individual or an organization, or, more generally, a dataset that allows the application of data driven Credit Portfolio Management policies. The appearance of credit data is quite familiar to practitioners: A spreadsheet, or a table in a database, with a number of columns and rows full of all sorts of information about borrowers and loans.
Representing Matrices as JSON Objects: Part 1

Representing Matrices as JSON Objects: Part 1

Representing a matrix as a JSON object is a task that appears in many modern data science contexts, in particular when one wants to exchange matrix data online. While there is no universally agreed way to achieve this task in all circumstances, in this series of posts we discuss a number of options and the associated tradeoffs.

Reading Time: 13 min.
Motivation and Objective Representing a matrix as a JSON object is a task that appears in many modern data science contexts, in particular when one wants to exchange matrix data online. There is no universally agreed way to achieve this task and various options are available depending on the matrix type and the programming tools and environment one has available. Matrices are not native structures in general purpose computing environments. They are typically handled with speficic packages (modules, extensions or libraries).
Visualization of a Planet in Lockdown

Visualization of a Planet in Lockdown

We visualize global mobility patterns over a full year of pandemic induced lockdowns

Reading Time: 5 min.
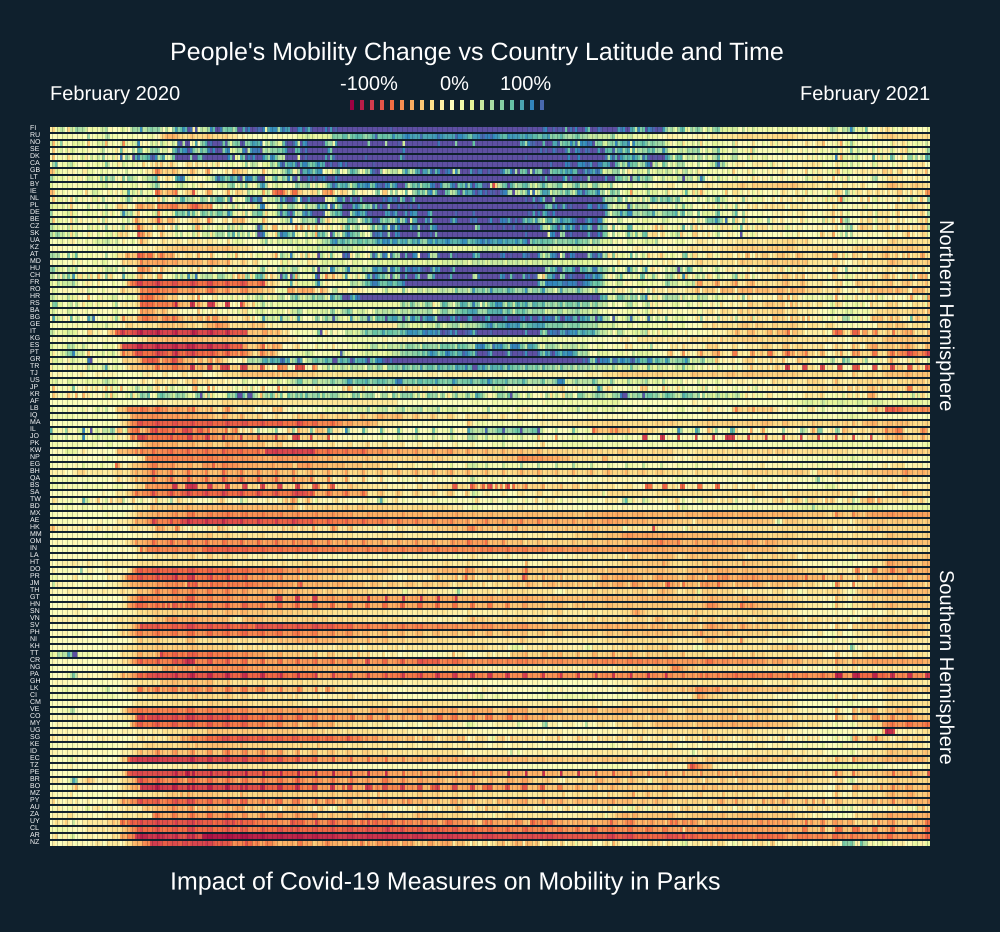
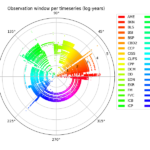
Visualizing a year in lockdowns and restricted mobility As we move into February 2021 the world will be experiencing almost a year under pandemic conditions. This has markedly changed behavioral patterns of human mobility across the board. One major difference with previous pandemics is that through the use of a variety of digital technologies and new data collection channels we know have an unprecedented view of those changing mobility patterns.
A Global Mobility Index

A Global Mobility Index

We introduce a global mobility index that averages Google mobility data across all available countries (weighting by population) to provide an overall view of how the pandemic has influenced human mobility

Reading Time: 6 min.
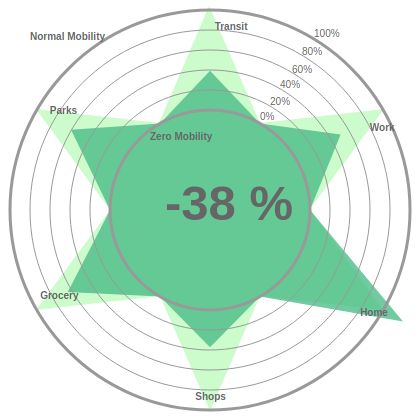
Constructing a Global Mobility Index (GMI) In previous posts (here, and here) we introduced new Open Risk Dashboard functionalities that integrate COVID-19 community mobility data (currently focusing on the datasets provided by Google). As a reminder, these reports chart over time human mobility trends collected from mobile geolocation data. The granularity is by geography and across different categories of places / activities such as retail and recreation areas, groceries and pharmacies, parks, transit stations, workplaces, and residential areas.
Comparing Google Community Mobility Reports Across Countries

Comparing Google Community Mobility Reports Across Countries

Reading Time: 5 min.
The community mobility reports and OpenCPM In a previous post we introduced new OpenCPM functionality that integrates COVID-19 community mobility data (currently from Google). The reports chart movement trends over time by geography, across different categories of places such as retail and recreation, groceries and pharmacies, parks, transit stations, workplaces, and residential. While these reports are unlikely to persist as open data sources in the long term, the current availability (as of May 2020) enables providing within OpenCPM a mobility data dashboard that can help draw insights through visualization and statistical analysis.
Exploring Community Mobility Reports Using OpenCPM

Exploring Community Mobility Reports Using OpenCPM

Reading Time: 7 min.
The community mobility reports and OpenCPM As the COVID-19 pandemic unfolded technology providers (most notably Google and Apple) made available to the public aggregated and anonymized data about human mobility in the crisis period (on the basis of smartphone location data). These Community Mobility Reports provide insights into how mobility patterns changed in response both to pandemic news and policies aimed at combating COVID-19. The reports chart movement trends over time by geography, across different categories of locations and activities, such as retail and recreation, groceries and pharmacies, parks, transit stations, workplaces, and residential.
Making Open Risk Data easier

Making Open Risk Data easier

We introduce an online database that allows the (relatively) easy publication of structured risk data

Reading Time: 1 min.
Making Open Risk Data easier In an earlier blog post we discussed the promise of Open Risk Data and how the widespread availability of good information that is relevant for risk management can substantially help mitigate diverse risks. The list of Open Risk Data providers, particularly from public sector, keeps increasing and we are aiming to document all available datasets in the dedicated page of the Open Risk Manual. The trailblazing Wikidata project In this post we want to introduce another facility, an online database that allows the (relatively) easy publication of structured risk data.
Visualization of large scale economic data sets

Visualization of large scale economic data sets

Reading Time: 3 min.
Visualization of large scale economic data sets Economic data are increasingly being aggregated and disseminated by Statistics Agencies and Central Banks using modern API’s (application programming interfaces) which enable unprecedented accessibility to wider audiences. In turn the availability of relevant information enables more informed decision-making by a variety of actors in both public and private sectors. An excellent example of such a modern facility is the European Central Bank’s Statistical Data Warehouse (SDW), an online economic data repository that provides features to access, find, compare, download and share the ECB’s published statistical information.
Machine learning approaches to synthetic credit data

Machine learning approaches to synthetic credit data

Reading Time: 9 min.
The challenge with historical credit data Historical credit data are vital for a host of credit portfolio management activities: Starting with assessment of the performance of different types of credits and all the way to the construction of sophisticated credit risk models. Such is the importance of data inputs that for risk models impacting significant decision-making / external reporting there are even prescribed minimum requirements for the type and quality of necessary historical credit data.
RegNews Upgrade and Dashboard Integration

RegNews Upgrade and Dashboard Integration

Reading Time: 0 min.
RegNews Upgrade and Dashboard Integration The Financial Regulatory News app (RegNews in short) is now integrated with the Open Risk Dashboard. The latest release adds several new feeds and allows filtering of news items by freshness (last day, last week, last two weeks) and by world-region (Supra-national, Americas, Europe and Middle East and Asia/Pacific). As always feedback on the features and usability of the RegNews app are welcome (simply use the button!
The Promise of Open Risk Data

The Promise of Open Risk Data

Reading Time: 3 min.
There is a legend that every time a data set is released into the open, somewhere dies a black swan The Promise of Open Risk Data Well, it is not a true legend. Legends take centuries of oral storytelling to form. In our frantic age, dominated by the daily news cycle and viral twitter storms, legends have been replaced by the rather more short-lived memes and #hashtags. Black Swans need no introductions The whole informal theory of black swans concerns improbable events (low likelihood events) that come as a nasty surprise and have large impact.
From Big Data, to Linked Data and Linked Models

From Big Data, to Linked Data and Linked Models

Reading Time: 5 min.
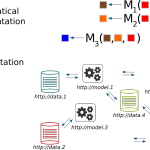
From Big Data, to Linked Data and Linked Models The big data problem: As certainly as the sun will set today, the big data explosion will lead to a big clean-up mess How do we know? It is simply a case of history repeating. We only have to study the still smouldering last chapter of banking industry history. Currently banks are portrayed as something akin to the village idiot as far as technology adoption is concerned (and there is certainly a nugget of truth to this).
Open Risk proud to be funded by EU FIWARE FINODEX accelerator

Open Risk proud to be funded by EU FIWARE FINODEX accelerator

Reading Time: 1 min.
Open Risk is proud to be funded by the FIWARE FINODEX accelerator! Finodex, the European accelerator for ICT projects based on Open Data and FIWARE technologies, has already chosen over one hundred projects via two open calls for proposal. This week the results of the second call evaluation closed in last September have been published, and 52 projects from a total of 297 have been chosen by a panel of experts.
Open Source Risk Data with MongoDB and Python

Open Source Risk Data with MongoDB and Python

Reading Time: 3 min.
Open Source Risk Data with MongoDB and Python Open source software is all the rage those days in IT and the concept is making rapid inroads in all parts of the enterprise. An earlier comprehensive survey by Gartner, Inc. found that by 2011 more than half of organizations surveyed had adopted open-source software (OSS) solutions as part of their IT strategy. This percentage may have currently exceeded the 75% mark according to open source advisory firms.
Visualizing the Stress of US Banks

Visualizing the Stress of US Banks

Reading Time: 4 min.
Visualizing the Stress of US Banks A recurring cycle of regulatory stress testing exercises has become the new normal in the banking world, at least on the two shores of the northern Atlantic. The periodicity of the European stress testing heartbeat has not yet been firmly established. Did we just miss a beat in 2015 (a so called palpitation) or will the European cycle have two (or more) years periodicity? Who knows.
EU Risk Dashboard Released

EU Risk Dashboard Released

Reading Time: 1 min.
EU Risk Dashboard Released About the app The EU Risk Dashboard is a web app developed by Open Risk to assist with the exploration and understanding of the large number of economic indicators published by the ECB in its Statistical Data Warehouse. The app data are derived from the timeseries available in the Warehouse. Most readings in the currently selected series are monthly and update automatically when those become available at the Warehouse.
New App Release: RegNews, the Regulatory News Aggregator

New App Release: RegNews, the Regulatory News Aggregator

Reading Time: 0 min.
RegNews, the Regulatory News Aggregator With all the ongoing activity around financial regulation having a convenient aggregation point for the main news is an indispensable tool for financial risk managers. This prompted us to build and roll out the Regulatory News App (RegNews in short), which is now live and freely accessible here. The app is designed to be usable both on a desktop and mobile environment. In line with the beta testing status of the entire Open Risk website, this app will evolve, subject to user comments and feedback!
Benchmarking and the future use of internal capital models

Benchmarking and the future use of internal capital models

Reading Time: 0 min.
The rationale for continuing with internal capital models in the Basel 3 world Overview of the challenges and opportunities offered by internal capital models (economic capital models) in the post-crisis era. Conference Presentation given at: Venue: 2nd Annual Capital Modelling under Basel III (Marcus Evans Conference) Location: London Time: January 28th 2014 Link to presentation: Local file