Developing a crowdsourced database of European Data Centers - assessing data quality
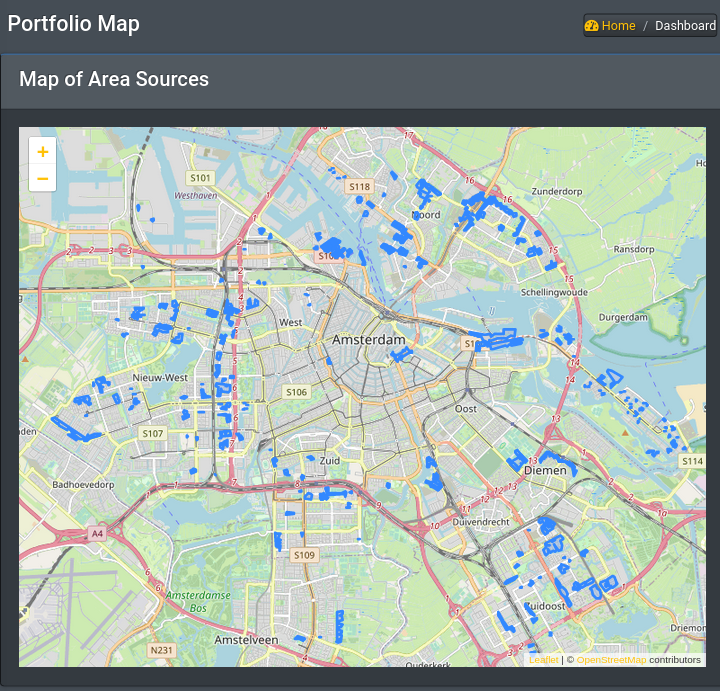
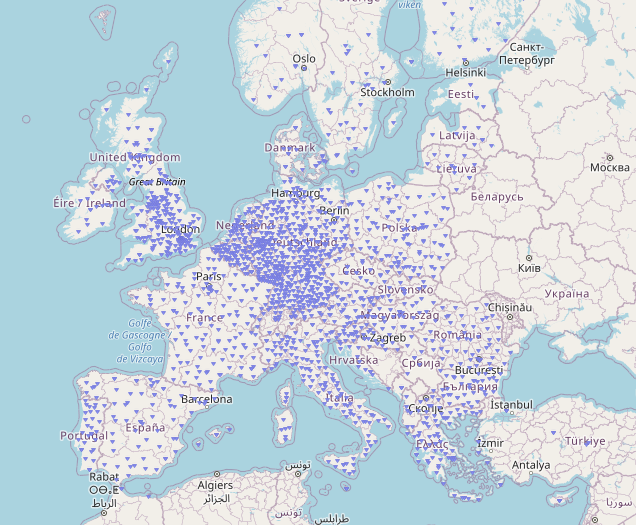
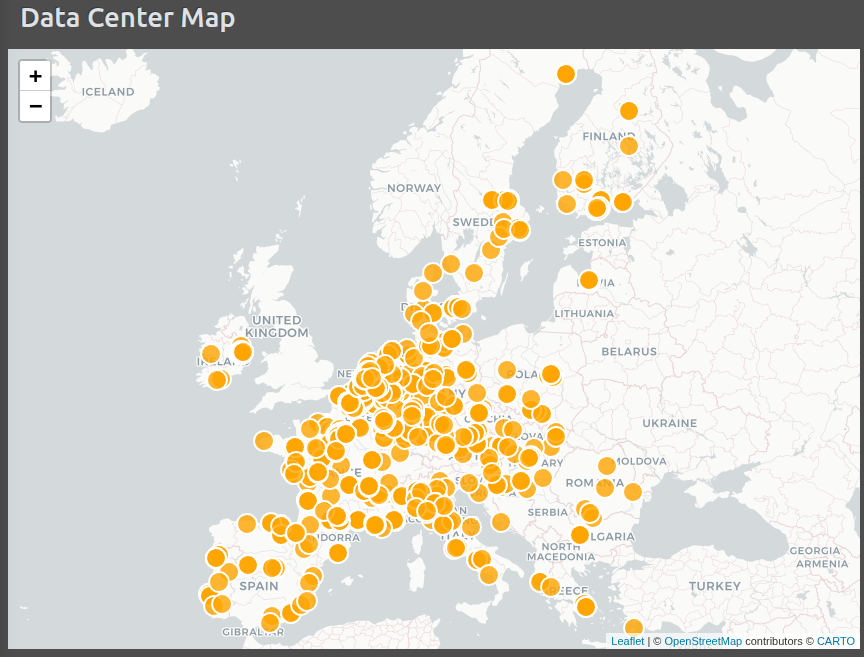
In this post we explore data quality challenges towards compiling a database of European Data Centers. The core dataset we use for this purpose is sourced from OpenStreetMap (OSM). OSM provides an inventory of geospatial features and other information that can serve as the basis towards a detailed data base of data center environmental impacts. We investigate what are some immediate data quality issues that we face in this task and possible ways to overcome them.
The euroDace project is a new geospatial database of European data centers that we launched recently. In this post we explore a first set of data quality challenges towards developing a more comprehensive and robust data center information database, with an eye towards inferring environmental impact footprints.