How Open Data and Open Source can support Green Public Procurement - Part 1
In the first part of this series we survey the TED procurement data landscape to build the context in which we will explore the relevance of this open data set for green public procurement
Introduction
In a series of posts we will explore the role of Open Data and Open Source in enabling and accelerating the broad based effort towards Green Public Procurement (GPP). There are several important (and possibly obscure) terms in this sentence, so our first order of business will be to unpack them.
What is Public Procurement
Let us start with the term Public Procurement which will be the main domain of interest in this study. Public procurement (or, alternatively, government procurement) is the market-based (at arms-length) acquisition of goods, services and works by public authorities (such as central governments, municipalities and other public sector entities) from private sector parties.
Public procurement is a major economic activity. In 2018, it amounted to \$11 trillion out of a global Gross Domestic Product (GDP) of nearly \$90 trillion1. In other words, 12 percent of global economic activity follows a pattern where a public entity acts as a buyer, in a market where private sector entities (companies small and large) act as sellers.
What about the term Green public procurement (GPP)? Given that public sector spending is a significant fraction of GDP, a consensus premise is that it could - under the right conditions - play an important role supporting the sustainability transition, understood as the re-orientation of economic activity towards long-term viable patterns. Viability is understood in terms of both environmental and social dimensions in which case one speaks of Sustainable Procurement, whereas GPP places emphasis on the environmental pillar. While in general where there is a will there is a way, achieving effective GPP sooner rather than later requires tools. This is where Open Data and Open Source can play a role.
Open Data is data that is openly accessible, exploitable, editable and shared by anyone for any purpose (potentially also commercially)2. Legally, besides being accessible, open data is data that is licensed under an open license. Such a license would typically spell out in some detail the privileges and obligations of the data users e.g., in terms of citations or further dissemination or exploitation possibilities. NB: some authorities may simply place data in the Public Domain without any defined license.
While the attribute Open applies in principle to data and information concerning any entity (whether an individual or a legal entity, a corporate entity or a non-profit etc.), in practice the publication of open data is most strongly developed as a movement and practice in the context of open government data (or public sector data more generally). The suitability and desirability of open government data derives from the fact that the lifecycle of such data (acquisition, processing, usage etc.) is done with public funds and in the name of the public interest. The adoption and utilization of open data is considered an important tool in improving transparency and good governance and there is a global monitoring effort3. In countries that are part of the European Union the state of Open Data is most directly observed in the official portal for European data) which currently features over a million datasets from thirty-six countries.
A separate burgeoning community and growing world-wide practice is the development of Open Source Software. “Open source” is any computer program (source code) that is made freely available for possible modification and redistribution. The open source movement in software began initially as a response to the limitations of proprietary (closed source) code for personal computing. Nowadays, there are open source software projects as realistic options in a vast array of domains. In many cases (e.g. cloud infrastructure based on linux) open source solutions are actually the preferred option. Another domain where open source has dramatically enhanced analytic capabilities is the broader Data Science and Machine Learning ecosystems. There is now an embarrassment of riches in those domains as there is a wide array of alternative options for handling both common and advanced analytic / quantitative tasks (See, e.g., Overview of the Julia-Python-R Universe for a side-by-side comparison of three popular ecosystems).
The relevance of open source software to open data stems from the fact that it is practically impossible to realise the benefits of information transparency without suitable data processing tools. Further, to the extent data are used to drive policy or decision-making, open source approaches add algorithmic transparency to data transparency.
In other words, while Open Data is akin to bringing fish closer to the people (as a metaphor for the riches of a well-governed commons), Open Source is enabling these people to catch that fish, that is, have the essential capabilities to extract information and meaning from data and do so in an accountable and transparent way.

The overlap of Open Data, Open Source and Public Procurement is already explored by visionary initiatives such as Open Contracting4. In this series of posts, our objective will be to explore how the super-powers of open data and open source might make a difference specifically in the world of Green Public Procurement. Our primary inspiration and asset in this journey will be EU Open Data for Public Procurement.
Green Public Procurement in Practice
Public procurement takes many forms, depending on the nature of required goods or services and the legal jurisdiction where it takes place. In recent decades (starting on a broad basis in the 1990’s) legislative activity has been based on procurement regulation proposed by the United Nations Commission on International Trade (1994). As we already discussed, while Sustainable Public Procurement is a broad umbrella term that covers all seventeen Sustainable Development Goals , the term Green Public Procurement has a narrower, more environmental focus.
With the development of GPP, governments have an additional lever to influence the structure of the economic system. In the process of procuring goods, works or services from the private sector, governments can both directly contribute to a reduced environmental impact (e.g., by reducing the greenhouse gas emissions embedded in those goods) and indirectly incentivise market participants to deliver a particular type of good or service.
Green Public Procurement encourages public authorities to procure goods, services or works with manifestly reduced environmental impact throughout their life cycle when compared to goods, services and works with the same primary function that would otherwise be procured.
The above definition of GPP alludes to the fact that at present GPP is largely a voluntary and aspirational instrument5. Nevertheless, governments, cities and other public sector entities around the world increasingly look into adopting GPP as a central pillar in their procurement philosophy as its potential becomes clear. For example, the EU Public Procurement Directive recognises the need to enable procurers to make better use of public procurement in support of common societal goals. It permits the inclusion of environmental considerations at various stages of the public procurement process, such as in technical specifications and contract awards.
Ultimately, it is up to EU countries and contracting authorities to decide if and when environmental considerations are actually included.6 In a recent article7 the authors argue that GPP continues to be underutilised in Europe, facing several barriers, but new EU regulatory action in this field could unlock its potential and add an important element to the European Green Deal toolbox. A summary of the significant overall challenges facing GPP can be compiled from the literature 7,8:
- The optional nature of GPP limits its uptake
- Political preferences play a role, as employees of public contracting agencies may be political appointments
- Under lowest price criteria, less expensive but less environmentally friendly products may be preferred over more expensive and greener alternatives that might be more cost-effective over the long term
- Legal complexity stemming from EU public procurement directives
- Purchasers limited knowledge and skills around sustainability
- Lack of established environmental criteria for goods or services
- Lack of cooperation between authorities and
- Lack of practical tools.
These caveats notwithstanding there are already successful pilot programmes9, and it is certainly possible to envisage tools that might facilitate further GPP uptake.
EU-Level Public Procurement Data
In the European Union the pre-eminent platform collecting data about public procurement is the Tenders Electronic Daily (TED) database10. TED registers all tenders above certain EU materiality thresholds,11 and it contains all active calls for tenders published in the Supplement to the Official Journal (OJS) of the European Union. Tenders for the three major procurement categories (products, works, and services) meeting these threshold values according to the procurement directives must be made public in order to ensure open competition and transparency in all EU Member States. The entities submitting tender data are public sector authorities (central governments, local or regional authorities, bodies governed by public law, European Union institutions or, bodies governed by public law)
TED data have been widely used in the (green) procurement literature. See, e.g., 12 for a recent study and review. A subset of the available data will be the basis for this series of blog posts. From a temporal perspective, in our study we consider all available data from years 2017 to 2021 inclusive. The data come in the form of XML files (Extensible Markup Language, abbreviated XML, is an open standard that describes a class of data objects called XML documents). Once we download the data from the TED repository we have the following overview:
- Total number of files: 3,050,551 (3 million) or about 50K files per month of tendering activity
- Total size on disk is 53 GB, or about 1GB per month of procurement data.
XML Encoding of the Public Procurement Process
While the individual file size of a procurement notice is small, the large number of files means there is a need to process them programmatically. For that we need to be able to parse the XML (load it into computer memory and be able to access its data content). How does XML look like? Here is a typical snippet:
    <TITLE>
        <P>Framework Contract – Technical and Logistical Support to the Activities of the Directorate-General Migration and Home Affairs and Related Policies
        </P>
    </TITLE>
    <REFERENCE_NUMBER>HOME/2018/ISFP/PR/EVNT/0016</REFERENCE_NUMBER>
    <CPV_MAIN>
        <CPV_CODE CODE="79900000"/>
    </CPV_MAIN>
    <TYPE_CONTRACT CTYPE="SERVICES"/>
    <SHORT_DESCR>
        <P>The Contracting Authority intends to conclude the framework contract for the purpose of providing technical and logistical support to activities of the Directorate-General Migration and Home Affairs (DG HOME) and its policies...</P>
    </SHORT_DESCR>
    <VAL_ESTIMATED_TOTAL CURRENCY="EUR">40000000.00</VAL_ESTIMATED_TOTAL>
    <NO_LOT_DIVISION/>
TED Schemas
While the overall structure of the TED XML forms has been relatively stable, there are both minor and major changes as the data collection adapts to evolving user needs (EProcurement Ontology ). For this exercise we will focus on the most recent family of XML schemas13 (R2.0.9). The schemata used by the 3 mln XML files in scope of our analysis are as follows:
| Schema | Frequency |
|---|---|
| R2.0.8 | 6.4% |
| R2.0.9.S01.E01 | 5.4% |
| R2.0.9.S02.E01 | 16.2% |
| R2.0.9.S03.E01 | 53.1% |
| R2.0.9.S04.E01 | 16.2% |
| R2.0.9.S05.E01 | 2.4% |
The implication is that focusing on the R2.0.9 family of schemas we leave out circa 6.4% (by count) of documents conforming to older schema versions.
TED Form Types
The XML forms are not uniform in structure. The data come in several distinct types of forms (14 in total), reflecting the different types and stages of the procurement process. Looking at the type of Forms present in the data collection is the first, high level, insight we get into what procurement processes takes place. The frequency distribution of the form types is as follows:
| Form Type | Frequency |
|---|---|
| F01_2014 | 1.96 |
| F02_2014 | 32.3 |
| F03_2014 | 34.1 |
| F04_2014 | 0.15 |
| F05_2014 | 3.30 |
| F06_2014 | 3.69 |
| F07_2014 | 0.12 |
| F08_2014 | 0.22 |
| F12_2014 | 0.22 |
| F13_2014 | 0.17 |
| F14_2014 | 11.0 |
| F15_2014 | 1.12 |
| F20_2014 | 2.94 |
| F21_2014 | 1.60 |
| F22_2014 | 0.03 |
| F23_2014 | 0.02 |
| F24_2014 | 0.25 |
| F25_2014 | 0.15 |
| N/A | 6.50 |
We notice that the Contract Notice (Form F02) and the Contract Award Notice (Form F03) are the most frequent forms used, followed by the Corrigendum (F14), a form that correct or updates a procurement process. The N/A category refers to old schemas.
Countries, Languages, Currencies
Public entities posting data on TED operate within a defined jurisdiction. This is captured in various ways in different forms, e.g., in terms of country of affiliation, various address elements, the language specification, currency indicators etc.
Looking first at countries we find that there is a large number of countries that appear in the dataset. Those with substantial participation (in terms of the number of entries) is quite a bit smaller. The overall frequency of countries (by count) is as follows:
| Country | Frequency |
|---|---|
| DE | 17.1 |
| FR | 14.8 |
| PL | 11.6 |
| ES | 5.7 |
| UK | 4.6 |
| CZ | 4.4 |
| IT | 3.5 |
| SE | 3 |
| BG | 2.8 |
| RO | 2.7 |
| NL | 2.6 |
| BE | 2.1 |
| SI | 1.7 |
| FI | 1.7 |
| NO | 1.6 |
| HU | 1.6 |
| AT | 1.3 |
| CH | 1.3 |
| LT | 1.3 |
| DK | 1.2 |
The frequency of appearance of each country in the data is a complex function of various factors: The absolute economic activity of a country (e.g., as measured by GDP), the size of the public sector, the structure of public procurement processes and the threshold levels are among those. Something important, from a practical perspective for accessing the information content, is that the dataset is multi-lingual.
At its core a procurement contract can be though as a swap. One leg of the swap is a stream of cashflows in some monetary unit (currency), the other leg is a provision of goods, services or works. Looking next at the applicable currency the picture is as follows:
| currency | round |
|---|---|
| EUR | 32.8 |
| PLN | 4.5 |
| GBP | 3.4 |
| CZK | 3.1 |
| BGN | 2.2 |
| RON | 2 |
| SEK | 1.3 |
| NOK | 0.9 |
| HUF | 0.8 |
| HRK | 0.7 |
| DKK | 0.7 |
| CHF | 0.4 |
| N/A | 47 |
We see that for almost half the forms (47%) there is no currency indicator (which suggests there was no explicit monetary value associated with the process). Around 30% of the entries (by count) have a monetary value in EUR. The rest is distributed in various other currencies used in Europe.
The distribution of procurement value
How much procurement value has been recorded in the system in these five years? If we do a simple sum of contractual values (Focusing on EUR only) we find a sum of 369,364,868,558,018.93 EUR, or 369 trillion! Despite the large EU economy, this sound quite a bit on the “high side”! What might be going on here? This will be a mini exercise on Data Integrity Validation .
Let us look at the statistical distribution of contract values more closely:
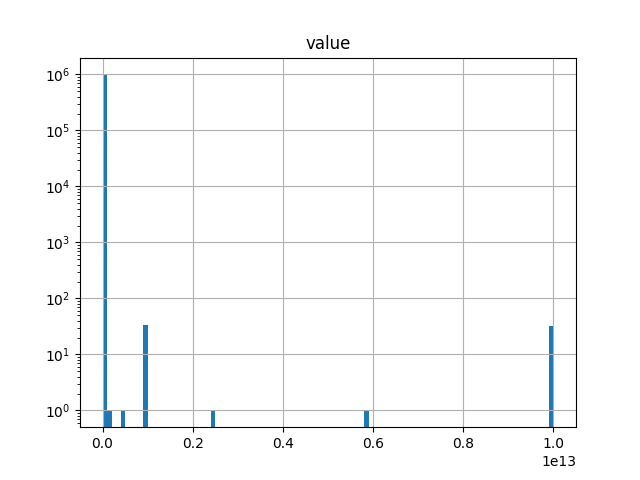
We immediately notice that the distribution is peculiar: There is large number of occurrences of suspect values. This means values that are either:
- extremely small values (either zero / one EUR), or
- very large values (trillion EUR)
Neither of these outlier values expresses the true economic value of a procurement contract. These large values are obtained, for example, by inserting a large number of “9”’s or “1” followed by zeros into the input form. To get a feel for the actual economic distribution of procurement value we must address these data quality issues. For our current purpose a simple approach is to eliminate too small and too large values. As an example of applying this principle, if we retain only contracts that indicate a value between 1K and 1 BLN (EUR) we get the following, more interesting picture.
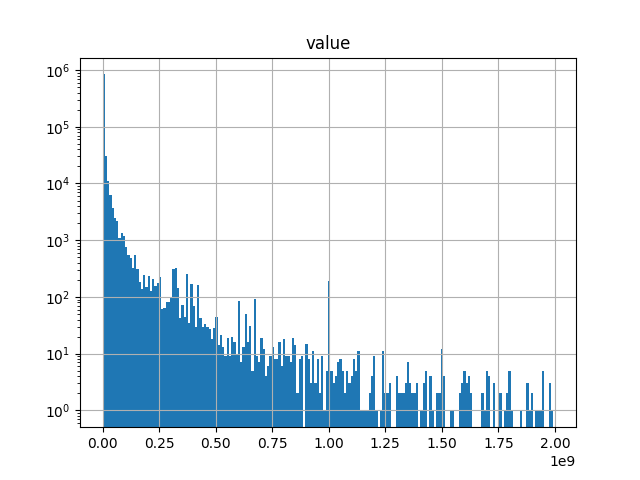
Notice that this is log-plot of frequency. It reveals an interesting (and plausible) distribution which is dominated by smaller value contracts but has a long tail into larger value contracts. If we sum this filtered value set we get a total figure of circa ~5.2e+12 (5 trillion EUR). This is 1 trn EUR per year, which, factoring a significant amount of double counting (as values would appear multiple times in notices, awards and corrections) seems at least a plausible number.
To get a further feel for what type of procurement process might be generating the distribution we look also at a log-log plot:
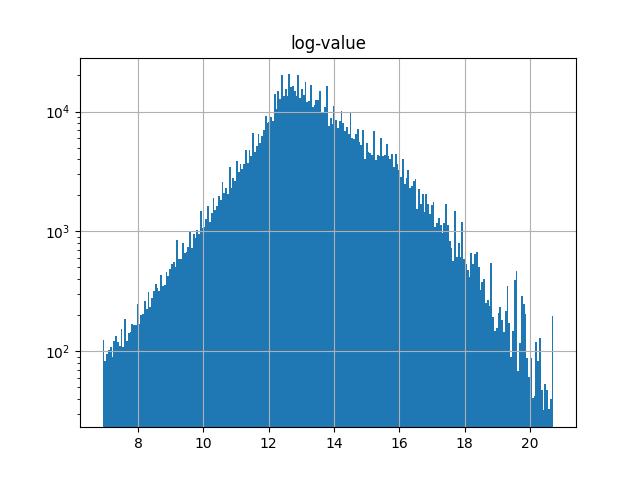
This is quite interesting! The plot suggests that there are different “parts” of the distribution, potentially due to different underlying processes (linked e.g. to the size distribution of procurement needs in different sectors). Exploring this TED dataset deeper and attempting to elicit what it says about European public procurement and in particular its environmental impact will be the subject of subsequent posts.
Next Posts in the Series
- Part 2 - Identification of Entities involved in procurement
- Part 3 - Attribution of GHG Emissions using the CPV classification
- Part 4 - Concepts of Portfolio Management in Procurement Context
Open Resources Used
In this section we will mention the various open resources (data, code, standards) we used, focusing on the most prominent items or those particularly enabling of a particular discussion.
Open Data Used
Open Source Tools Used
Open Standards Used
References
-
How large is public procurement? World Bank Blog Post ↩︎
-
Towards mandatory Green Public Procurement (GPP) requirements under the EU Green Deal: reconsidering the role of public procurement as an environmental policy tool, K. Pouikli, ERA Forum (2021) 21:699–721 ↩︎
-
Green Public Procurement: A Neglected Tool in the European Green Deal Toolbox? A. Sapir, T. Schraepen and S. Tagliapietra, Intereconomics, 2022, 57(3) ↩︎ ↩︎
-
New directions for research in green public procurement: The challenge of inter-stakeholder tensions P.F. Johnson, R.D. Klassen ↩︎
-
Public procurement in EU countries is only regulated by EU procurement rules when the value of tenders exceeds a certain threshold that depends on the type of procurement and sector, and when tenders are presumed to be of cross-border interest ↩︎
-
Getting the green light on green public procurement: Macro and meso determinants. J. Rosell. Journal of Cleaner Production 279 (2021) ↩︎
-
The full list of TED schemas ↩︎