How Open Data and Open Source can support Green Public Procurement - Part 2
In the second part of this series we explore how to construct an economic network representation of the public procurement universe
Introduction
This is the second in a series of posts where we explore the role of Open Data and Open Source in enabling and accelerating the broad based effort towards Green Public Procurement (GPP).
Recap of the Previous Post
In the first part of this series we motivated and defined the scope of a study that explores Public Procurement data. We discussed the meaning of the main relevant terms (Open Data, Open Source, Green Public Procurement) and briefly reviewed the current state and challenges of the latter in EU context. Further, we took a first look into the EU’s TED Database (which is the main source of data for this study) and highlighted some key statistics which bring to light information such as: the size of the dataset, its overall structure and some data quality aspects.
In this second instalment we will dig deeper into an important facet of the data, with the aim of constructing a meaningful economic representation of the public procurement process. This exercise does not generate any new information in itself. It is a conceptual map and guide towards a suitable data model. Making sure that this model is adapted to the economic processes captured by the data will help us organize their interpretation and analysis. Further, aligning the data model with key elements found in other domains (e.g. financial portfolio management) means the tools can be more easily align with evolving methodologies for calculating the environmental impact of economic activity.
Economic Networks and Environmentally Extended Input-Output Models
The interconnectedness of economic activity is an essential, if not the defining attribute of human economies. Yet historically the large body of classic economic literature rarely made use of the concept of economic networks. For reasons that have to do with expediency (data availability) and tractability (for quantitative analysis), a number of assumptions helped abstract away from the need to capture the detailed connectivity exhibited by real economies. The picture is changing rapidly in recent years, as many fruitful lines of inquiry are now being developed around economic networks or graphs of various types. The conceptual framework we will adopt is that of interconnected agents engaging in economic activities such as trading and contracts of various forms. The “agent” we will focus on this post is, of course, the public procurement entity.
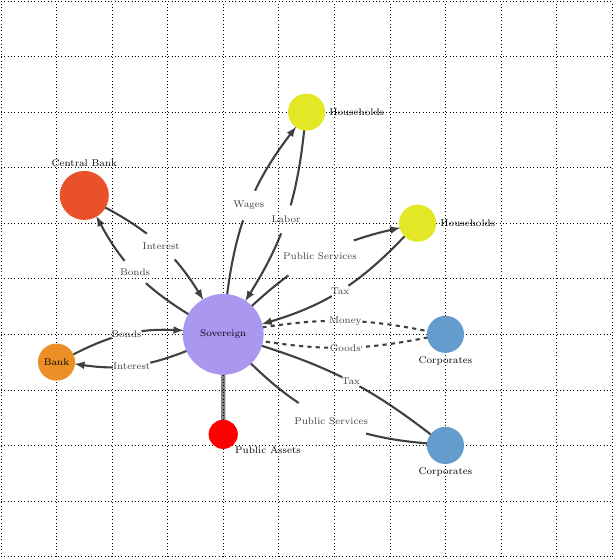
The above is a visual illustration (From 1) of a sovereign (public sector) node and its interactions with other economic agents acting as nodes in the network. A defining characteristic of the sovereign node (with its various sub-nodes such as sub-sovereigns, public utilities etc.) is that it interacts with all other economic nodes via taxation and provision of public goods and services. The public sector may employ a sizable fraction of households and purchase goods and services from the corporate sector using public procurement. Sovereign debt is, in turn, held by both the central bank and private banks.
Broadly speaking building a detailed (granular) economic network representation involves the following steps:
- Identify the legal entities involved in economic activity
- Establish the contractual relations between these legal entities
- Establish the history of interactions as the different entities go through the procurement process
While conceptually clear, the scarcity of whom-to-whom economic data means that it remains a challenge to construct complete economic networks where the circular flow of resources across the different entities is captured. This complicates, among others, the attribution of responsibility, e.g. for environmental impact:
Who is actually responsible for a given quantum of adverse environmental impact? Is it the primary extraction industry of e.g., gas or oil, is it the processing or transport sectors, or is it the ultimate consumer (whether individuals or the public sector)? Or is it maybe the financial intermediaries enabling the flow of funds and services, or finally, is it maybe the marketing entities generating consumer demand?
These are difficult questions that only recently begun to being tackled in earnest. They have given rise to, for example, three distinct views of attribution of GHG emissions (territorial, production and consumption oriented). They highlight that simplistic accounting and attribution frameworks do not tell the entire story (and thus may not identify optimal or complete policy options).
In practice the primary aggregation level where an economic network representation is feasible is currently at the macro (sectoral) statistical level. Such complete economic flow diagrams are compiled by (national) statistical agencies and go by the name Input-Output Models. The extension of such models to include various environmental stressors goes by the name Environmentally-Extended Input Output Analysis, or EEIO . See also and Academy Course for introductions.
Processing Contracting Authority Profile Data
Continuing with the processing of the TED Database that we have begun in the previous post, we focus now on procurement entity data. There are main two types of legal entities that are documented in the TED Database. Buyers (Contracting Entities) and *Sellers. The identity of the contracting authority is always documented in any of the forms used. When there is a contract award, there may be also an indication of the identity of the sellers.
In general, data collected about the contracting authority and the procurement contract are quite a bit richer (e.g., in the number and meaning of fields) than the details about the seller. It is worth keeping in mind it is the buyer or contracting authority that compiles the data.
Contracting Authority Data fields
The identification and classification of contracting authorities is based on data entered by form submitters (principally Section I of the various TED forms). Such data comprise three types:
- Identification Information, using fields such as Official Name and National ID - if available
- Classification Information, using a predefined list of entity types and entity activities
- Address Information (Postal code, NUTS region etc.)
- Contact Information (Phone number, on-line URL etc.)
In the 2017-2021 set, after applying our basic schema and form filters (See Post 1) to focus on recent schemas (R2.0.9) and standard forms (F01-F14) we work with circa 2.67 million documents from which we can extract buyer identification and classification information.
Data Quality
Let us first take a look at the data quality of the fields that identify a contracting authority. Of all the relevant fields, those that exhibit a material count of null values (field not populated) are illustrated in the next table:
| Field | Null Value (%) |
|---|---|
| Address | 2.2 |
| Contact Point | 28.8 |
| Entity Activity | 36.5 |
| Entity Type | 39.3 |
| Fax | 53 |
| National ID | 51.1 |
| Phone | 24.6 |
| Postal Code | 2.2 |
| URL Buyer | 49.2 |
While missing data in fields such as Fax are maybe not surprising2, other fields (such as the National ID of the procurement entity) are more problematic. All entries have a populated Official Name field, but the textual nature of that field opens up the door for inconsistencies in identification. This makes unique identification harder (more labor-intensive) and less certain (more error-prone).
Availability of National ID per Country
In principle, a National ID field would serve as a readily available unique identification field, so it is worth drilling down further on its availability, grouping, e.g., by country
| Country | Total Forms | With National ID | Incomplete (%) |
|---|---|---|---|
| DE | 491596 | 22937 | 95.3 |
| FR | 420791 | 148132 | 64.8 |
| PL | 328947 | 94073 | 71.4 |
| ES | 165955 | 142653 | 14 |
| UK | 127391 | 7052 | 94.5 |
| CZ | 124423 | 120165 | 3.4 |
| IT | 100934 | 10303 | 89.8 |
| SE | 85944 | 84526 | 1.6 |
| BG | 78830 | 78759 | 0.1 |
| RO | 78130 | 77966 | 0.2 |
| NL | 73467 | 66929 | 8.9 |
| BE | 60518 | 43830 | 27.6 |
| SI | 49635 | 49578 | 0.1 |
| FI | 49314 | 45926 | 6.9 |
| NO | 46847 | 46579 | 0.6 |
| HU | 46741 | 46617 | 0.3 |
| AT | 37068 | 14037 | 62.1 |
| CH | 36390 | 5 | 100 |
The above statistical picture suggests several countries have the National ID field populated quite consistently but this is far from being the norm across all European countries.
How many distinct Buyers engage in public procurement in Europe?
We turn now to addressing the question of how many distinct entities are engaging in public procurement. The answer to this question is not unique. First, we have the impact of our own imposed filters (such as the scope of the dataset - which we limited to between 2017-2021 and our focus on relatively recent formats). The absence of unique identifiers and a mechanism to indicate potential linkages between authorities means there is also an intrinsic ambiguity about which of the entities represented are actually independent operating units.
- On the basis of distinct official names we find 212,183 entities, which sets the rough order of magnitude for the size of the European public procurement ecosystem
- On the basis of distinct address combinations (address, postal code and town) the number is even higher (264,961), reflecting potentially the considerable scope for textual variations during data entry
- On the basis of distinct URL’s (websites) the number is lower (82,815). This suggests the presence of significant numbers of related entities using a common website and/or potentially further DQ issues affecting official name variations.
What types if Buyers are there?
Now that we have a first idea about how many distinct entities are out there let us take a look at what kind of public entities these are. At the highest level there are two broad categories of buyers:
- contracting authorities and
- contracting entities
The difference is not always clear (or very formally defined) but in general the former are entities from central or local government and the latter are entities associated with the provision of public utility services.
The full list of buyer entity types encountered in the dataset is:
| Procurement Entity Type |
|---|
| EU Institution |
| European Institution/Agency or International Organisation |
| National Agency |
| National or federal Agency/Office |
| Ministry or any other national or federal authority |
| Ministry |
| Regional Agency |
| Regional or local authority |
| Regional Authority |
| Regional or local Agency/Office |
| Body governed by public law |
| Body Public |
| Utilities entity |
| Not specified |
| Not applicable |
| Other |
Conceptually, besides the Utility Entity already mentioned, the essential further grouping is into:
- Supra-National entities (Such as European Institutions)
- National level entities (Such as Ministries)
- Regional entities (Such as Cities / Local Authorities)
The public procurement of these three hierarchical sub-groups will also have substantially different geographical distribution scope. In turn this will have implications for the more accurate allocation of the environmental impact of public procurement. In principle this classification of public entities will also to some degree determine the type of procurement that is being pursued (given the different roles and needs of local and national authorities). Yet given jurisdictional and other differences between countries, the actual profile as derived from procurement contracts is more relevant as it may deviate from the label.
What are the Buyers busy with?
Within each of the broad categories, public entities are also (self-)characterised by their main activities (defined here more narrowly for the purposes of public procurement documentation). We encounter the following activities in the database:
| Procurement Entity Activity |
|---|
| Recreation, culture and religion |
| Housing and community amenities |
| Environment |
| Education |
| Urban railway / light rail, metro, tramway, trolleybus or bus services |
| Water |
| Extraction of gas and oil |
| Social protection |
| Airport-related activities |
| Production, transport and distribution of gas and heat |
| Public order and safety |
| Postal services |
| Port-related activities / Maritime or inland waterway |
| Exploration and extraction of coal and other solid fuels |
| Economic and financial affairs |
| Railway services |
| Defence |
| Electricity |
| Health |
| General public services |
| Not applicable |
| Not specified |
| Other |
A simple scan of the above main activity list suggests that the environmental footprint of public entities will be modulated quite heavily by the activity attribute (compare e.g., the category “production, transport and distribution of gas and heat” with “recreation, culture and religion”). Nevertheless, the above attributes are simply labels. In this study we will seek to associate the impact of activities on the basis of actual procurement information.
Where are the Buyers located geographically?
There are 2483 distinct entries in the NUTS field within the sample dataset. Given that the current NUTS 2021 classification3 lists 92 regions at NUTS 1 level, 242 regions at NUTS 2 and 1166 regions at NUTS 3 level it is clear that the field has data quality issues. Nevertheless, there is a substantial amount of valid NUTS 3 level data, which means that contracting entities can be grouped of the basis of geographical location. A feeling of the geographical participation in the dataset is given be the below graphic:
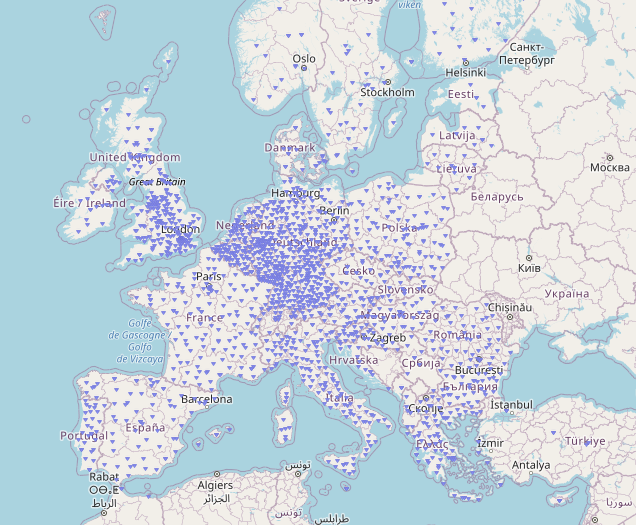
We see that (at least visually), the distribution of contracting authorities over the geography of Europe is well-developed in terms of distinct NUTS3 regions appearing in the dataset. To be clear, the intensity of participation of a region in public procurement in terms of e.g. the number, value and diversity of procurement contracts are all distinct and different dimensions are not illustrated in the above map!
Next Posts in the Series
- Part 3 - Attribution of GHG Emissions using the CPV classification
- Part 4 - Concepts of Portfolio Management in Procurement Context
Open Resources Used
In this section we continue listing various open resources (data, code, standards) that have been used for the discussion (the list is incremental over previous posts, so as not to produce and repeat an excessively long list!)
Open Data
- Eurostat NUTS Notice: © EuroGeographics for NUTS point coordinates
Open Source Tools
Open Standards
References
-
Open Risk White Paper 8: Connecting the Dots: Economic Networks as Property Graphs ↩︎
-
Maybe the fact that 47% of authorities still use fax should be the surprise here! ↩︎