How Open Data and Open Source can support Green Public Procurement - Part 4
In the fourth part of this series we approach Green Public Procurement as a Sustainable Portfolio Management task and explore how open data can support this mission
Introduction
In this fourth and final installment we will discuss how the data framework we have developed thus far can be mapped into classic portfolio management concepts and categories, and thus, how one can articulate the concept of sustainable procurement management on a portfolio basis. The concepts and analytic methodologies of financial portfolio management1 can significantly enhance the toolkit available to practitioners and, in sense, connects the domain of Green Public Procurement to other ongoing initiatives in broader Sustainable Finance.
Recap of Previous Posts
In the earlier installments of this series of posts we motivated and defined the scope of our exploration of Public Procurement data, we dug deeper into constructing economic representations of the public procurement process. We also linked procurement entities to private sector sellers. Through the sectoral profile of the procurement contract we inferred the amount of CO2 emissions that can be attributed to these activities.
- Part 1 - Overview of the Public Procurement TED dataset
- Part 2 - Identification of Entities involved in procurement
- Part 3 - Attribution of GHG Emissions using the CPV classification
The Equinox Portfolio Data Models in Procurement Context
We now elaborate on the mapping of TED procurement data into the Equinox data models. This mapping forms the basis for making available a set of well established tools of portfolio management. It should be noted right away that the TED dataset does not include the information required for a full mapping. Indicatively some types of information that is not generally available but may be available in a more specific use context:
- Information about concrete Assets, such as quantitative and qualitative data concerning real estate assets, production facilities or any other tangible asset that may be related to the procurement. These are not readily available through TED forms, though the might be available through linked documentation.
- Information about the Stakeholders, Communities, Guarantors, Banks and any other Legal Entities that may be involved with or affected by a given project.
Nevertheless, there is sufficient information to allow a meaningful demonstration. So without further ado, let us lay out the approach.
Buyers (Contracting Authorities)
A Buyer (A Contracting Authority) will be considered in our portfolio management context as a Portfolio Manager (i.e., the portfolio owner or principal that is, among others, able to apply policies and other management actions). The portfolio manager is a core entity in the Equinox platform. Depending on the use context, an equinox instance may only involve one portfolio manager or possibly several.
A Seller (Contractor) is a Counterparty to the Buyer or portfolio manager (holds the other end of a procurement contract).
To make the discussion more tangible let us focus on a particular subset of the TED Dataset focused on the Netherlands. In Post 2 - Identification of Entities we discussed in some detail the identification process of procurement entities. Here we explore an important additional dimension: Identifying the procurement activity of each entity. After applying rudimentary filters to isolate unique procurement entities we have for the Netherlands (and the entire 2017-2021 period) circa 1,543 distinct entities (that appear at least once in the TED dataset as contracting authority on a form). If we order Dutch Contracting Authorities by activity we get the following top-10 entities.
| Entity | Count |
|---|---|
| www.rotterdam.nl | 3420 |
| www.rijkswaterstaat.nl | 2063 |
| www.rijksoverheid.nl | 1956 |
| www.defensie.nl | 1661 |
| www.tenderned.nl | 1618 |
| www.prorail.nl | 1027 |
| www.ingenieursbureau.amsterdam.nl | 847 |
| www.denhaag.nl | 836 |
| www.utrecht.nl | 832 |
| www.rijksvastgoedbedrijf.nl | 749 |
We notice a combination of national-level entities and local authorities. At the other end of the spectrum, there are large number of entities that only appear once. As we did with the contract value distribution in Post 1, it is interesting to see the log-log plot of contracting activity:
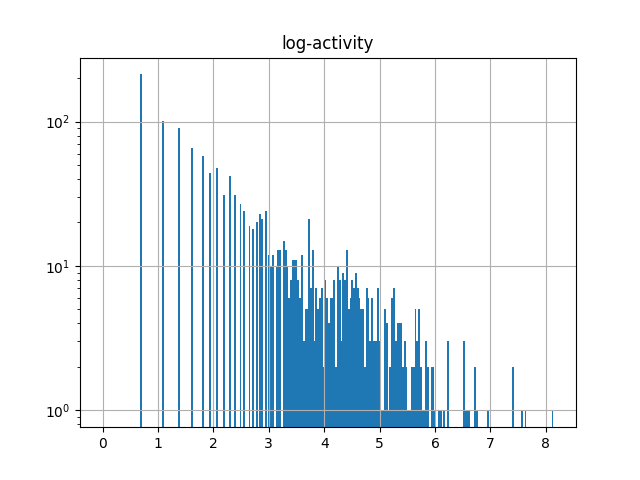
We see again an interesting power law pattern.2
The GHG Project Concept
Buyers will, in general, engage in ongoing and repeated procurement activity. Each individual procurement exercise is initiated by a buyer. In the Equinox (and GHG Protocol) nomenclature a distinct procurement process is a GHG Project. As such it has an (in-principle defined) sustainability footprint. The name Project alludes also to Project Finance , which concerns typically the long-term financing of major infrastructure and industrial projects. The portfolio management of such projects would be indeed be separate use case of the equinox platform.
Project Categories and Sectors
A Project Category is a flexible hierarchical system for classifying the projects of a portfolio. The standard, pre-build procurement categories are the classic distinction into Works, Supplies, Services that is used in the TED database. The categories have interesting repercussions also on the type of sustainability footprint associated with a contract. For example, for many supplies, the impact is likely entirely embodied (has been produced during the manufacturing phase). On the other hand a works contract may have impact during its execution (e.g. new building construction).
Procurement Contracts involve economic exchanges with operators active in one or more business sectors. The primary sectoral hierarchy in the context is the CPV classification, with its further correspondences to official economic nomenclatures such as CN, CPA or NACE. As we discussed in some detail in the previous post of the series, in the absence of more detailed data the association of a procurement activity with a business sector is the readily available means for estimating the quantum of GHG emissions associated with that activity on average (as it follows from the overall estimated footprint of major business sectors).
Project Stages and the Procurement Transition Matrix
Projects have intrinsic uncertainty, which means that the path of the procurement process is not deterministic but goes through possible stages, corrections etc., before eventually possibly culminating into a successful (awarded and completed) contract. The precise trajectory is affected by internal considerations of the procurement entity and the state of the market at any given moment.
In a real-life portfolio management situation a procurement manager would have a portfolio of projects at various stages (some in preparation, some for which there procurement activity is ongoing, some for which the awarded contract is being executed etc.). It should be evident that the only part of the procurement lifecycle that we could hope to reconstruct exclusively using the TED database is the “middle” section of the procurement process, after a notice has been posted and up until a contract has been awarded (or not).
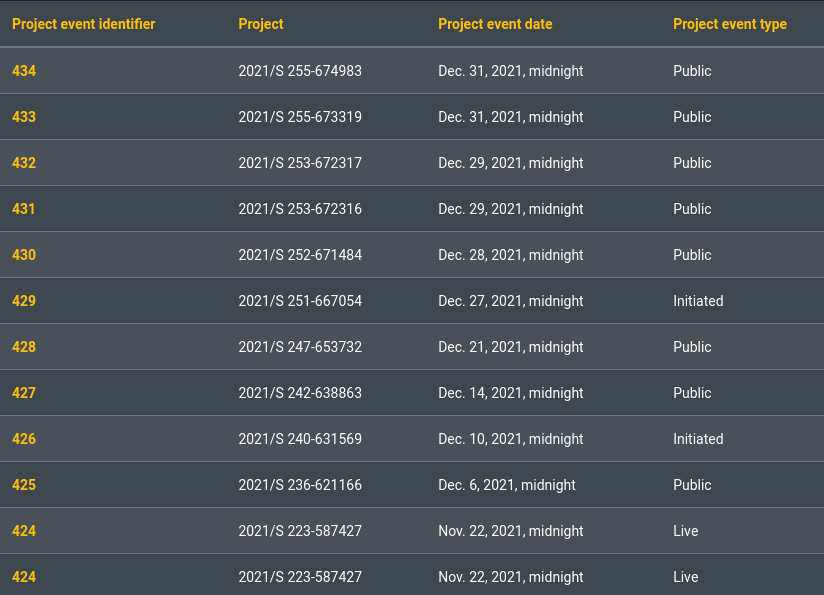
How can we reconstruct the timeline and status transitions of different procurement projects that appear in the TED database? This is not an entirely trivial pursuit. Given unique identifiers one can readily find all notices associated with a procurement entity. Yet reconstructing the logic of the procurement activity in terms of discrete procurement objectives is a more painstaking and potentially manual process.
What is possible with programmatic means is achievable on the basis of available data such as the XML element REF_NOTICE. This piece of information links - where applicable - a given notice, with a prior notice. For example a contract award notice (published under Form F03) may link to a preceding contract notice (published under Form F02). This is captured in the below table (transition matrix):
Transition Rates from a given procurement stage to the next procurement stage
| TO | |||||||||||||
|---|---|---|---|---|---|---|---|---|---|---|---|---|---|
| FROM | 1 | 2 | 3 | 4 | 5 | 6 | 7 | 8 | 12 | 13 | 14 | ||
| Prior information notice | F01_2014 | 1 | 0.00% | 2.63% | 0.35% | 0.00% | 0.02% | 0.00% | 0.00% | 0.00% | 0.00% | 0.00% | 0.18% |
| Contract notice | F02_2014 | 2 | 0.55% | 56.94% | 0.02% | 0.01% | 19.44% | ||||||
| Contract award notice | F03_2014 | 3 | 0.03% | 1.58% | 0.37% | ||||||||
| Periodic indicative notice - utilities | F04_2014 | 4 | 0.23% | 0.04% | 0.02% | ||||||||
| Contract notice - utilities | F05_2014 | 5 | 0.02% | 0.07% | 5.60% | 2.94% | |||||||
| Contract award notice - utilities | F06_2014 | 6 | 0.16% | 0.06% | |||||||||
| Qualification system - utilities | F07_2014 | 7 | 0.42% | 0.05% | 0.02% | ||||||||
| Notice on a buyer profile | F08_2014 | 8 | 0.07% | 0.01% | |||||||||
| Design contest notice | F12_2014 | 12 | 0.07% | 0.26% | 0.10% | ||||||||
| Results of design contest | F13_2014 | 13 | 0.01% | 0.00% | |||||||||
| Corrigendum | F14_2014 | 14 | 0.02% | 0.26% | 0.03% | 0.04% |
Estimating transition rate matrices such as the above is a standard portfolio management activity. We see that the transition matrix is quite “busy” (lots of possible transitions are indicated) but the overwhelmingly most frequent trajectory paths3 4 (highlighted in bold) are rather few: Namely F2 -> F3 (57%) or, in words, from contract notice to contract award, with the possible excursion into F14 (20%) which is a correction of the original contract. The corresponding path for utilities (F05 -> F06) is also noticeable.
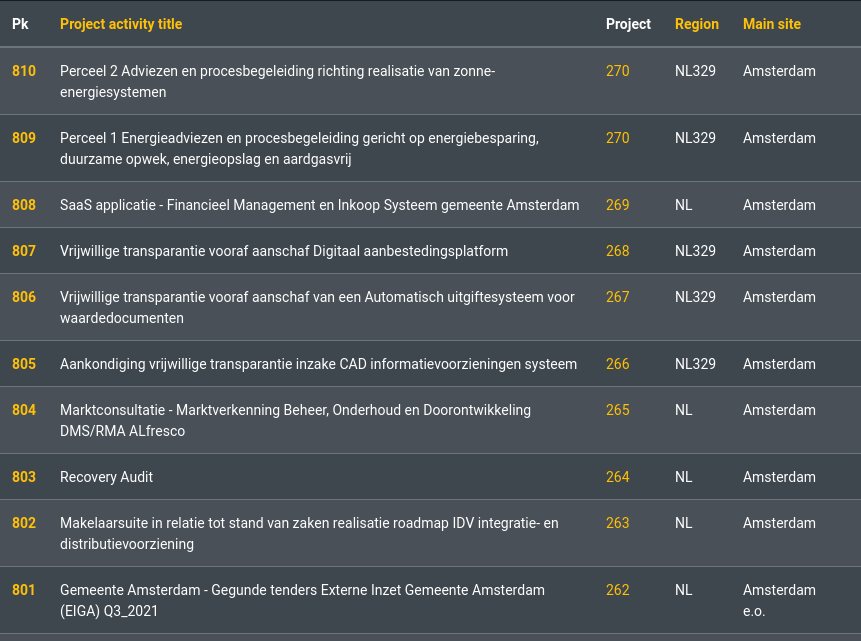
Project Activities and Contractors
Any project, being a defined economic activity has an environmental impact. When there are specific data available around e.g. the proposed works, the impact could be analysed ex-ante using the GHG Protocol for Projects.5 The desired end-state of a procurement process (an award notice) indicates a realized contract with one or more sellers or providers (contractors). Such a contract may have multiple counterparties (different operators, suppliers etc.).
In the equinox data model a Project is an umbrella concept that may optionally be resolved into multiple Project Activities. This nomenclature corresponds, on the one hand, to the GHG Protocol where an Activity is the evaluation unit for a sustainability initiative, on the other hand, in procurement context this additional resolution can be used to capture multiple contracts awarded to different contractors.
Procurement Portfolios are ultimately Portfolios of Contracts of a swap nature, where over a certain period of time the two main counterparties exchange monetary amounts in return for goods or services as stipulated in the contracts.
A Project Portfolio is the Collection of all Projects and associated activities (Contracts) of a Buyer. These contracts are bilateral (Bank Loans, Financial Swaps or Insurance contracts etc.) and may include a large number of additional legal clauses. GPP Criteria are, in particular, contractual clauses that may be optionally included in the language of the contract.
Emissions Sources and Reports
An Emissions Source is the fundamental abstraction used in Equinox for representing environmental impact from GHG emissions associated with different contracts. It holds the information about:
- what type of GHG gas is emitted and
- how much of each GHG gas is emitted by any concrete source associated with the portfolio.
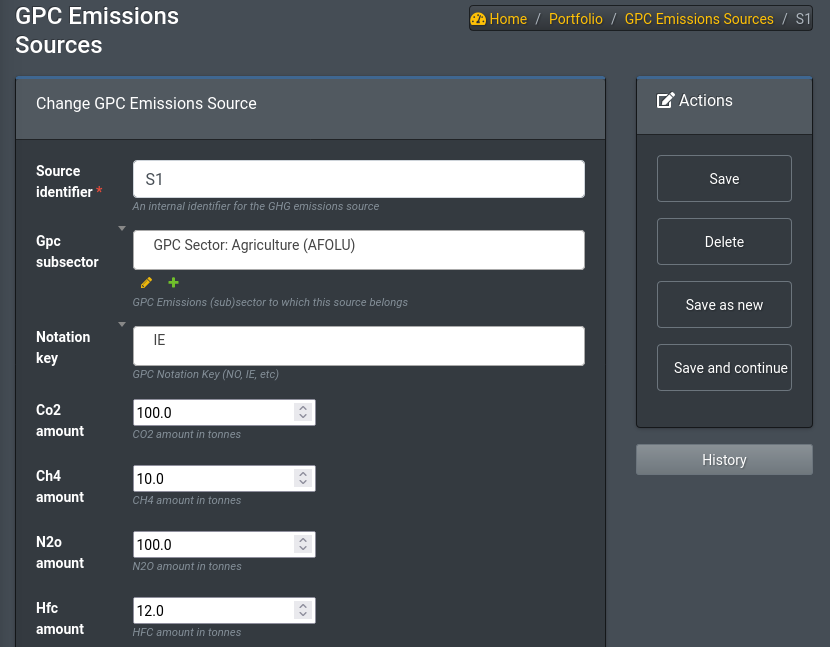
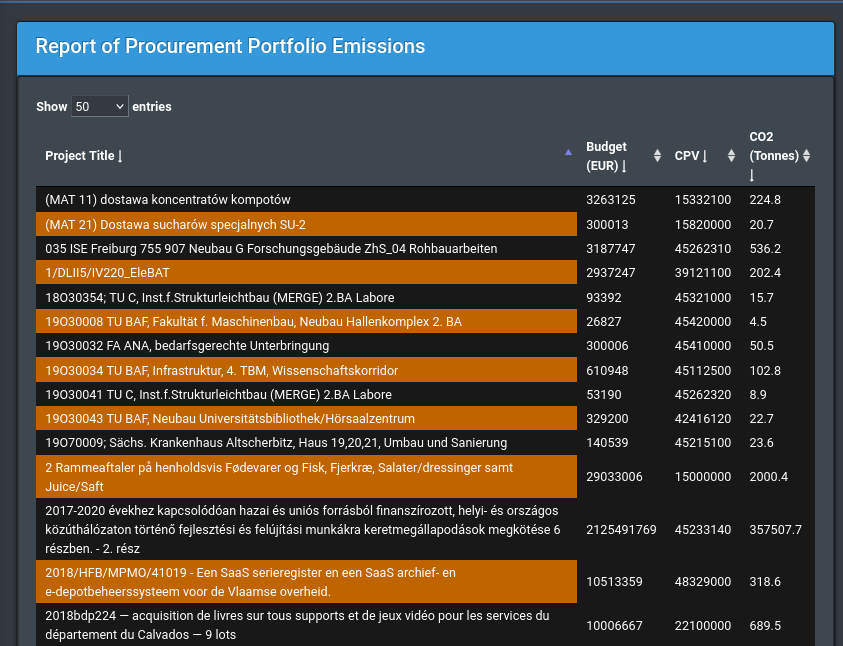
Aggregating all sources in the portfolio produces a standard emissions report
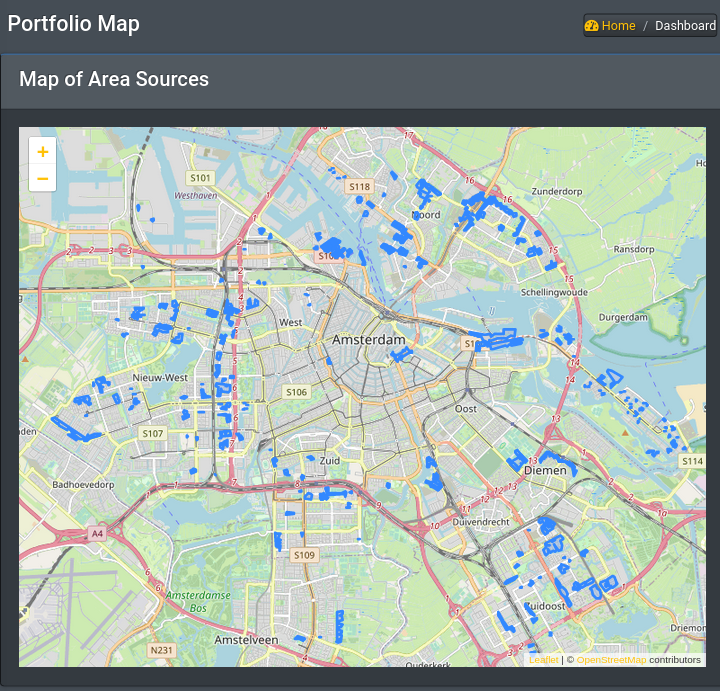
Geospatial Views
Subject to being able to associate specific project data with geospatial features it is readily possible to create a geographical portfolio emissions map:
Epilogue
This post concludes our discussion of the role of Open Data and Open Source in enabling and accelerating the broad based effort towards Green Public Procurement (GPP). We have barely scratched the surface of what is possible, but hopefully we were able to convince you that the combination creates powerful, enabling tools the can play a significant role in the sustainability transition!
Open Resources Used
In this section we continue listing various open resources (data, code, standards) that have been used for the discussion (incrementally over previous posts, so as not to produce and repeat excessively long lists)
Open Data
Open Source Tools
- equinox, an open source solution for sustainable portfolio management
- transitionMatrix, statistical analysis and visualization of state transition phenomena
Notes and References
-
Formal Portfolio Management tools span a wide range: From various statistical analyses and views of portfolio data, to targets and limit frameworks, scenario analysis, risk management, capital allocation and more. ↩︎
-
Power Laws are ubiquitous in economics and finance (and of-course many physical / biological systems) ↩︎
-
We should note here that the frequency is on the basis of overall statistics - many of the forms are specialized and do not see much use. ↩︎
-
For legibility we suppress displaying the statistics of the Forms above F14 ↩︎
-
While the materiality of different procurement tasks (and hence the degree to which the contracting authority considers environmental impact in depth) may vary significantly, this is simply a quantitative matter. ↩︎