The Pros and Cons of Full Stack Risk Management
We discuss the concept of full stack risk management and how to acquire holistic knowledge of the many layers of processes and tools that are involved in modern, data driven risk management. We compare and contrast with the existing characterisation of full stack developers in software and the pros and cons of generalizing that pattern to risk management. We use an example from credit risk management to bring the various issues to life.
Motivation
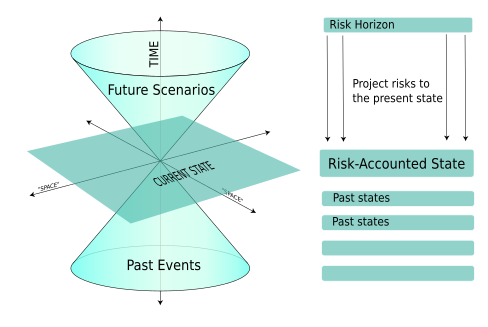
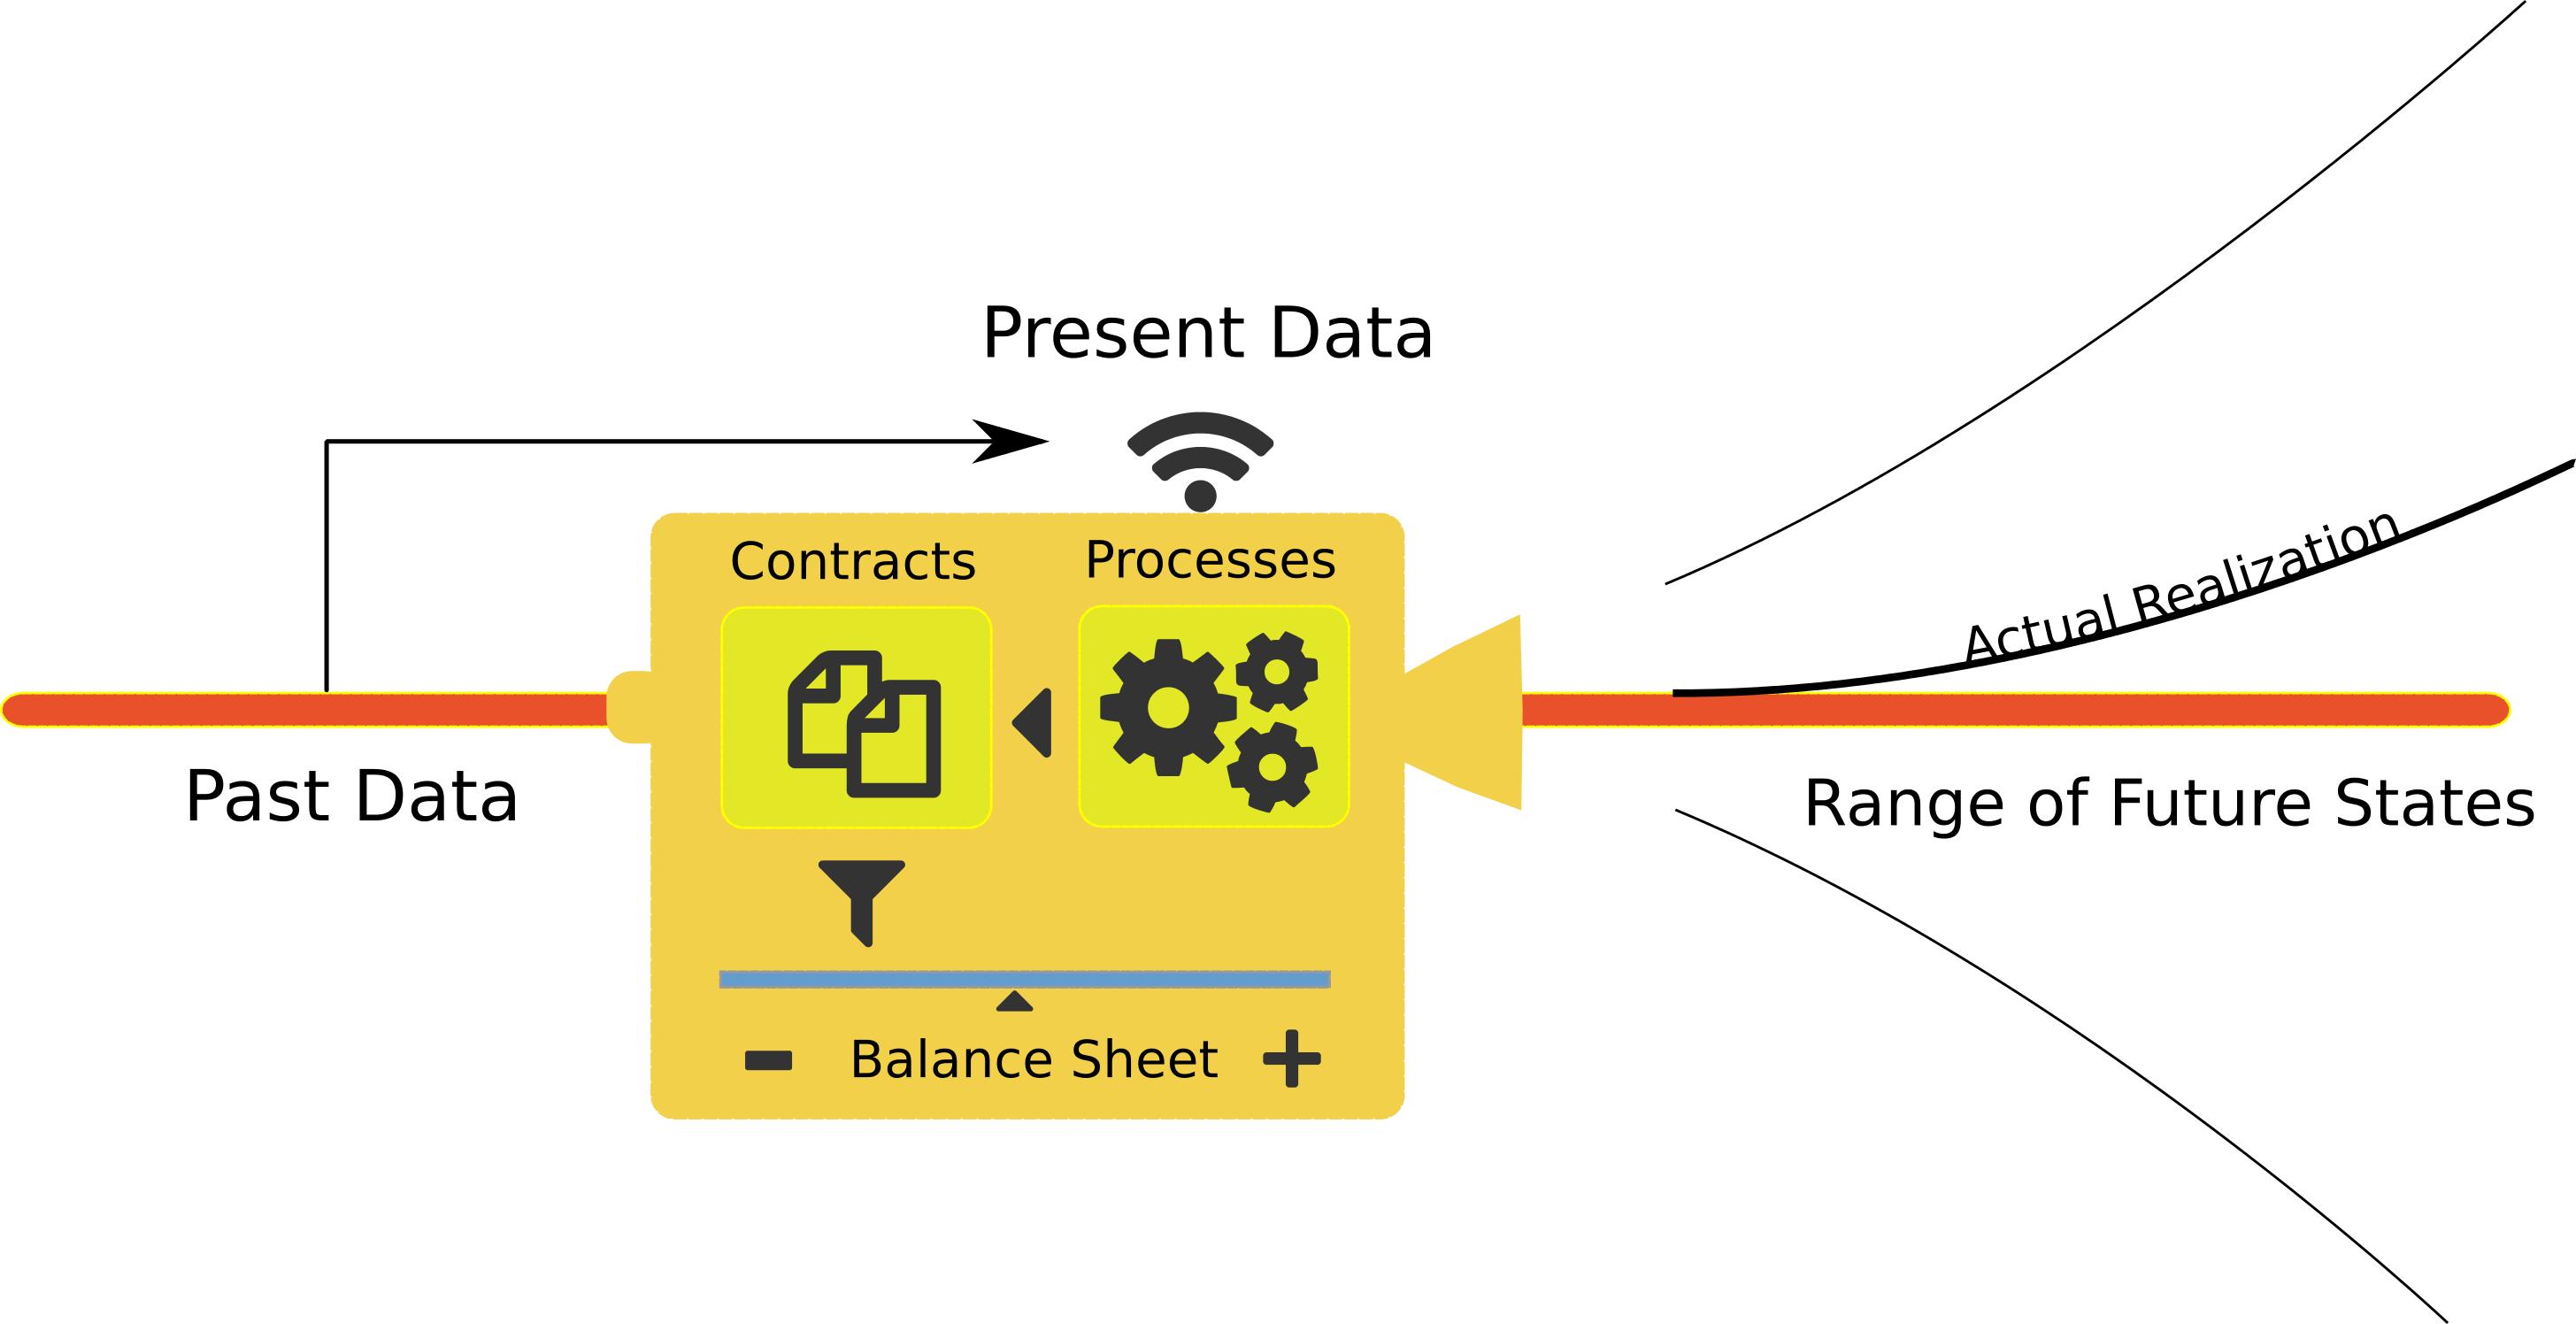
An Open Risk Academy user recently asked if there is a real-world, end-to-end open-source project (in particular, written in the popular data science language Python) that walks through the entire (risk model) workflow: namely, collecting data, engineering features, building a risk model, iteratively optimizing it, and drawing actionable conclusions. It is a very good question. For many people learning theory in the context of real-world practice is essential and such an end-to-end example obviously helps connect all the dots of data driven risk management. But like with all good questions, the answer is not simple. In this blog post we explore some of the issues involved in a broader context.