Thousands of possible social media platforms - but is anyone actually good?
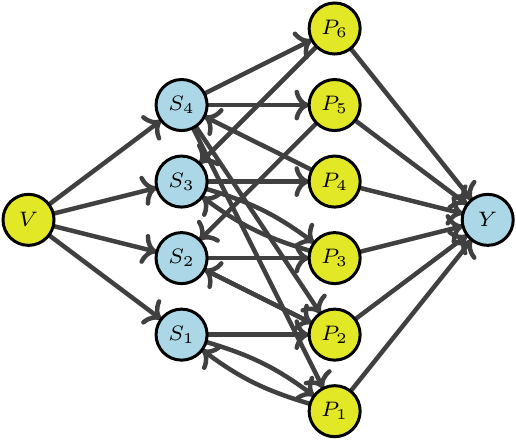
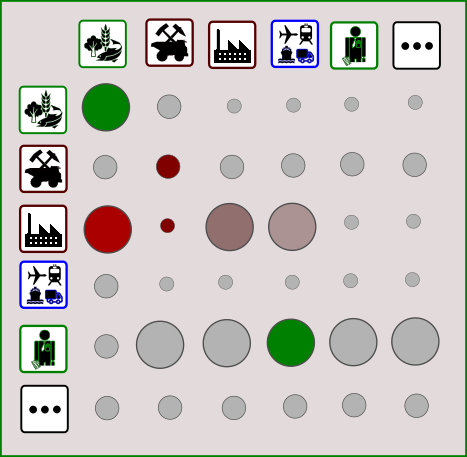
In this post we explore the configuration space of possible social media platforms. We show that already with the known possible design choices there are multiple thousands of possibilities. Are better social media experiences to be found within this vast space or do we need an even more fundamental rethink? And how can we go about finding out?
Over the past two decades with the rapid diffusion of digital technologies billions of people changed behaviors. Almost everybody now is spending considerable time online, interacting with other people in newly invented social media. Diverse software platforms enable exchanges of all sorts of information over internet network infrastructures. Given the massive adoption there is little doubt that people derive meaningful utility from social media. At the same time a range of seriously negative impacts is becoming increasingly clear.