9 Ways Graphs Show Up in Data Science

We explore a variety of distinct uses of graph structures in data science. We review various important graph types and sketch their linkages and relationships. The review provides an operational guide towards a better overall understanding of those powerful tools

Graph of Data Science Graphs

Graphs seem to be everywhere in modern data science

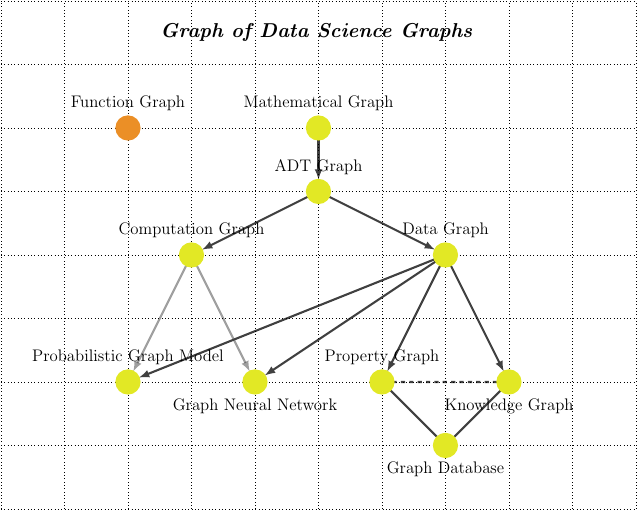
Graphs (and the related concept of Networks) have emerged from a relative mathematical and physics niche to an ubiquitous model for describing and interpreting various phenomena. While the scholarly account of how this came about would probably need a dedicated book, there is no doubt that one of the key factors that increased the visibility of the graph concept is the near universal adoption of digital social networks. These platforms offer a tangible demonstration of the concept of a social graph and linked entities.

Graphs in their various types are now explored more systematically in many domains. Describing systems as interconnected entities is an important and growing methodology in diverse areas of economics, finance and risk management. In a white paper we developed a property graph framework that maps economic networks formed through contractual relationships between agents (and the interdependencies those generate).

In this blog post we will review various important graph types as they are increasingly explored in data science and we will sketch their linkages and relationships (a graph of graphs!). This is not meant to be a rigorous mathematical or computer science classification but rather an operational guide towards a better overall understanding of those powerful tools. A second caveat is that it is not meant to cover absolutely every sub-class of algorithm that involves graphs but rather highlight two major branches (Cases 8 and 9).

What is a graph?

The etymology of the word graph goes back to Ancient Greece. It derives from the word “γραφή” which means writing. As a lexical component it appears in countless English words, from geography to paragraph and from graphics to graphic novels. Here we will focus on the - far more narrow - graph structure concept as it is used in diverse modern applications of informatics and data science. It is actually at its core a very simple and intuitive concept:

Informally, a graph is simply the enumeration of things and their relationships

Let us take things one-at-time, first tackling a concept that includes graph in its name and is used in data science but it is not a graph in the spirit of enumerating things and their relationships!

0. The Graph of a Function

The object most people that are not mathematicians, computer or data scientists would recognize as a “graph” is actually quite distinct from all the other uses of graphs that we will review below. It is namely the graph of a function. An alternative name for these graphs is simply the Plot, as per below example:

Function Graph

Graphing functions is extremely useful and common. The name of this activity finds its way, for example, in Graphing Calculators. The visualization of a function graph requires the following structure which we discussed more extensively in a post dedicated to visualization of timeseries. In summary, the full function graph structure involves a visualization map $(x, y) \rightarrow (T(x), T(y))$, where the independent value $x$ is converted into a plot coordinate $T(x)$ and displayed (by convention) along a horizontal dimension and, similarly, the dependent value $y$ is converted into a plot coordinate $T(y)$ ranging along a vertical dimension.

Definition: The graph of a function $f$ is the set of ordered pairs $(x, y),$ where $f(x) = y$ represented visually using a map $(x, y) \rightarrow (T(x), T(y))$.
Purpose: Represent visually a function of one variable (generalized to 2D as well)

So, now that we have cleared up this important but unrelated use of the term graph, we can move on!

The relationship of visualization with exploratory data analysis is covered in dedicated Open Risk Academy course as part of the Data Science collection.

1. The Mathematical Graph

We now discuss what mathematicians would recognize as a proper “Graph”, which one way or another underlies all other graphs we will encounter in this journey. The mathematical graph is a concept that appears in the branch of mathematics appropriately called Graph Theory. This area goes back already to 18th century mathematics, the work of Leonhard Euler and the famous Seven Bridges of Königsberg problem.

Seven Bridges of Königsberg

The problem posed by the seven bridges can be stated as follows: Is there a way (a trail) through all the sections of the city that crosses all bridges exactly once? Euler proved that the problem has no solution and in the process laid the foundations for a rich branch of mathematics that is still very much active.1 2

Definition: A mathematical graph is the tuple $G = (V, E, \partial^{+}, \partial^{-})$ where $V$ is a set fo vertices, $E$ is a set of edges and $\partial^{+/-}: E \rightarrow V$ are maps called incident relations.
Purpose: Define rigorously a graph as a mathematical object to help prove general statements

The definition is appropriately minimalistic: It only introduces the absolutely necessary elements. In the common visual depiction of such a graph the vertices and edges (incident relations) of the graph are shown as a collection of nodes and links. It is important to keep in mind that this is only a visualization of what is the underlying abstract concept. For example in the below picture the “Seven Bridges” are the graph links and the nodes are the different city sections:

Abstract Graph

Mathematical graphs are the starting point for exploring general structure and properties. Users of graph theory frequently pose and solve general statements about graphs. For example, the famous four color theorem states that, given any separation of a plane into contiguous regions (tiles) no more than four colors are required to color these regions so that no two adjacent regions have the same color.

Before we proceed to more distinct graph usage examples, it is worth mentioning that the function graph we described above *does not map to a mathematical graph in any obvious way. Graph theory is part of discrete mathematics whereas function graphs would probably be associated with real analysis (if you read till the end you might find a hint how the two join up again!)

2. The Abstract Data Type Graph

Closely related to mathematical graphs, but sufficiently distinct that it merits its own category is the Abstract Data Type Graph that is defined and used in theoretical computer science. Before discussing ADT graphs we need to introduce ADT more generally: In computer science, an abstract data type (ADT) is a mathematical model for data types (classifications of information clusters implementable e.g., in digital computers). An abstract data type is defined in terms of possible values and possible operations on these values.

Similar to the mathematical graph, and ADT graph data structure consists of a finite set of vertices (also called nodes), together with a set of unordered pairs of these vertices in the case of an undirected graph or a set of ordered pairs in the case of a directed graph. In directed graphs there is a distinct from-to direction associated with each edge (the order matters). In undirected graphs link represented by the edge is symmetric and the direction is not relevant.

Definition: An abstract data type graph is a data structure that contains a set of finite number of vertices and a set of finite number of edges, together with a set of operations that is used for defining, manipulating and abstracting the vertices and edges.
Purpose: Conceptually extend a mathematical graph to address concrete data types and operations on those values

An ADT graph makes the mathematical graph object more concrete and pliable, by considering, for example, mutations of nodes and vertices as the result of operations. 3 An indicative list of abstract graph operations on graph $G$ would include:

  • adjacent(G, x, y): tests whether there is an edge from the vertex x to the vertex y;
  • neighbors(G, x): lists all vertices y such that there is an edge from the vertex x to the vertex y;
  • add_vertex(G, x): adds the vertex x, if it is not there;
  • remove_vertex(G, x): removes the vertex x, if it is there;
  • add_edge(G, x, y): adds the edge from the vertex x to the vertex y, if it is not there;
  • remove_edge(G, x, y): removes the edge from the vertex x to the vertex y, if it is there;
  • get_vertex_value(G, x): returns the value associated with the vertex x;
  • set_vertex_value(G, x, v): sets the value associated with the vertex x to v.
  • get_edge_value(G, x, y): returns the value associated with the edge (x, y);
  • set_edge_value(G, x, y, v): sets the value associated with the edge (x, y) to v.

We see that in contrast with the mathematical graph which aims to prove general statements about graph structures, an ADT graph aims to create a useful abstraction for pushing bits around graph objects.

We now move on to consider two typical examples of putting ADT graphs into concrete use: computation graphs and data graphs.

3. Computation Graphs

Computation graphs (Other names: pipeline graph, dataflow graph, alternative spelling: computational graph) are graphs that describe and implement sequences of numerical computations in digital computers. They have received great visibility in the context of machine learning where they are used to express the typically large number of interlinked computations but essentially any complex computation involves such a graph.

The graph representation of computation graphs is not unique, yet the underlying strategy is quite straightforward: Use nodes and edges to fully decompose and describe a given calculation in terms of more elementary operations. In this exercise nodes represent either data values (e.g. tensors) or functions. The edges denote input / output relations between values and functions. For example, the function $F(x,y) = x^2 + y^2$ could be represented as follows:

Computation Graph

A notable element of computation graphs is that they must be acyclic. This means that there cannot be cycles (paths that close unto themselves) in the graph (A computation graph with cycles would be akin to try to travel back in time and compute the starting value)

Definition: A computation graph is directed acyclic graph representation of computations, where nodes and edges encapsulate the input / output relations of values and elementary functions
Purpose: Decompose and represent complex calculations and data processing pipelines

We see that computation graphs in their simplest use are essentially book-keeping tools that help translate mathematical formulas into code.

4. Data Graphs

A data graph is easy to define now that we have covered both ADT Graphs and their Computation Graph specialization. While, ultimately functions are data, it is a very special type of data who’s utility expressed when applied to other values. It is very fruitful to consider graphs where all elements are basic data types whose utility derives directly from the value.

Definition: A data graph is an ADT graph where all elements of the graph are basic data types (whether primitive or composite) such as numerical, strings, arrays etc. A data graph does not include function types.
Purpose: Serve as the root class for a variety of more specialized data graph objects such as property graphs adn knowledge graphs.

5. Property Graphs

While computation graphs link values and functions, a large and growing group of practical applications focuses exclusively on relations between values (data). A property graph is a data graph where additional information about nodes and edges is integrated consistently. A property graph uses graph structures (our well known nodes and edges) but, importantly, introduces the flexible notion of properties to represent and store a wide range of information. In the below diagram we illustrate such a rich graph structure representing economic relations and interactions of a household (a family) with various other economic agents (from the white paper). Each node is associated with information about the economic state of each agend and edges captures various types of economic interactions (transactions, contracts etc).

Property Graph

While there is no unique specification of property graphs, a fairly general framework is the labeled property graph model. This model augments the simple mathematical graph model $G = (V , E)$ with labels that define different subsets (or classes or types) of vertices and edges. In addition, every vertex and edge can have any number of properties. A property or attribute is quite generally any pair (key, value) where the key identifies a property and the value is its value.

Definition: A labelled property graph is defined as a tuple $G = (V, E, L, l_v , l_e , K, W , p_v , p_e)$, where $l_v, l_e$ are the labelling functions segmenting the nodes and edges, $K, W$ are the spaces spanned by keys and values respectively and $p_v, p_e$ are the maps of key-value pairs to nodes and edges respectively.
Purpose: Define a flexible graph data structure that can add arbitrary amounts of additional information to an underlying relation graph

6. Knowledge Graphs

Knowledge Graphs is a class of data graphs that is arguably not fundamentally different from the previous (property graph) category. Yet the fairly imposing name (another term used is semantic network) suggests that at least the intention and targeted use case of knowledge graphs has some distinguishing characteristics.

A knowledge graph is a data graph that aims to represents “knowledge” as concepts and the relationships between them (facts). Its data model aims to define the “meaning” of data in the context of its interrelationships with other data. Thus a node representing a Person can be identified by a web of relations (statements) that are unique to what we perceive to characterise a person.

As with any data graph, a knowledge graph defines abstract classes and relations of entities in a schema, and it allows for potentially interrelating arbitrary entities with each other. The additional functionality supported by the specification of a knowledge graph is reasoning over inferred ontologies. Such reasoning infers the logical consequences of a set of asserted axioms in an ontology.4

A visual representation of the fact base of a very large knowledge graph is offered by DBPedia:

DB Pedia

Definition: A knowledge graph is directed labelled graph defined as a tuple $G = (V, E, L, l_v , l_e )$, where $l_v, l_e$ are the labelling functions segmenting the nodes and edges.
Purpose Represent concepts their relationships in a flexible manner that in addition allows discovering logically implied relations

The alert reader might have observed that the definition of a knowledge graph seems to be simpler than a property graph. This is in a sense true: Quite central to knowledge graph technologies is the idea of “normalizing” relations between concepts into subject, predicate, object triplets (the prime example being the resource description framework (RDF) and associated technologies like OWL). While this normalized approach is quite cumbersome for describing e.g., arrays of data values, it is conceptually simpler.

An initiative to build a risk management oriented knowledge graph is Open Risk Data.

7. Graph Databases

While the property graphs and knowledge graphs we discussed above focus on the nature of data values and their relationships, important practical considerations when using graphs are their persistence (storage) and interaction with (loading, querying, updating etc).

Providing practical tools and functionalities along these lines is the domain of graph databases. There are various types of such databases and some good attempts to provide a taxonomy, see e.g.,5. A graph database is simply any database that allows storing and querying data organized in graph structures (nodes, edges and associated values).

The unique selling point of graph databases is that data relationships are first-class citizens. This is reflected e.g. in the query language, the application programming interface (API) and/or the speed with which graph oriented operations might be executed.

Definition: A graph database is any database that can practically serve the semantics and intended utility of a data graph, whether that is a property graph, a knowledge graph or any other well defined graph specification.
Purpose: Provide practical means for users to persist graph data structures and retrieve, query and/or operate on such stored data

Two important points to make about graph databases:

  • Graph databases are complex pieces of software. The data graph abstraction(s) facilitated by the database, while providing the appropriate conceptual framework for thinking and working with the data need not have any close resemblance with the internal (low level) implementation.
  • While sometimes graph databases are presented as the evolution (or next stage) of relational databases in fact their relationship (pun) is quite a bit more complex. Already the name “relational” in relational databases suggests that relations are part of the design of conventional databases used in the last decades. Conceptually, relational databases can be seen as highly optimized graph databases: Some important relationships between values are captured via predefined and more rigid mechanisms. There is no better way to understand this deep link between classic relational databases and graph databases than to try to implement the latter using the former6. This is precisely the subject of this interesting presentation.

In summary, graph databases bring data modelling realism and practicality to the more abstract data graph versions we have encountered before. Besides persistence, they support various forms of querying for data (as per conventional databases) but in addition will typically support graph algorithms.

8. Probabilistic Graph Models

All the applications of graphs we have considered so far take place in a deterministic context. What does this mean? It does not mean that the graph is static or immutable structure (updates are possible). It also does not mean that the graph is known in advance: In the context of computation graphs we saw that there is also a certain sense of temporal flow. Outcomes of computations are revealed sequentially through the application of functions. Yet in all the above use cases the outcomes of all operations, queries are supposed to be reproducible exactly.

Now we will discuss two important applications of graphs that do not share this characteristic but introduce in a non-trivial way the notion of randomness.

A probabilistic graphical model is a multivariate probabilistic model that incorporates a graph structure. Each node of the graph represents a random variable. The graph edges encode relations (dependencies) between the random variables. Compared to the graphs we have encountered so far PGM’s present some essential differences:

  • the core mathematical object (the multivariate random variable distribution) is much bigger than the graph itself
  • there are many possible probabilistic graphical models defined using the same graph. This reflects different possible distributional assumptions that can be made about a given number of random variables, the free model parameters etc.

Parametric PGM models can be represented as $(G, θ) ∈ (G × Θ)$, where G is a graph of relationships among variables, $θ$ is the graphical model parameters, $G$ is the space of the graphs and $Θ$ is the parameter space. While we will not go into details of such models, estimation is more complex than classic statistical models as both graph structure and parameters must be estimated consistently. The following diagram is an illustration of such a graph estimated from financial data.

DB Pedia

The typology of PGM is quite broad (including things such as Bayesian Networks, Gaussian Random Fields etc) which may incorporate directed or undirected (or even combinations thereof) graphs to capture the dependency structure. Hence, a concise mathematical definition is not possible. Quite generally though we can state:

Definition: A probabilistic graphical model is a multivariate statistical model where the dependency of component random variables is expressed by a sparse graph structure.
Purpose: Capture dependencies between random factors using the intuitive tool of graphs

PGM's are a stepping stone towards casual reasoning and advanced techniques in statistical inferencing, in particular when the measured system is subject to controlled interventions.

9. Graph Neural Networks (GNN)

A graph neural network (GNN) is a neural network where the topology of the input data is a data graph. Thus the input data to some classification or related machine learning task are not the usual n-dimensional array data (sometimes denoted as having Euclidean topology) but have rather the sparsely connected graph topology. Despite this significant alteration, like all neural networks (and supervised learning more generally) a graph neural network model is learnt (estimated) in the usual way, mapping input features (of nodes and/or edges) to output features of the same.

Neural Network

Similarly to the probabilistic graph models we discussed already, a graph neural network defines a broad class of mathematical models. The structure of the network fixes a number of distributional / functional features (which constrain the structure of the network and free parameters). A key difference with PGM is that in a PGM model the graph is an element of the model specification itself (the dependency structure of various random variables). So a different graph means a different model, whereas in a GNN the graph structure is a characteristic of the input data and the same GNN model could process different graphs.

Definition: A graph neural network is a neural network algorithm that admits as input data a data graph
Purpose: Expand the scope of neural network algorithms by adding data graphs to possible input data

Something worth mentioning here (indicated already in the Graph of Graph Relations diagram) is that both PGM and GNN models involve a second graph, namely their respective model computation graph. Yet requiring a computation graph is a characteristic of any probabilistic / statistical model estimation and thus it is not the reason those model families have graph in their name!

A number of API’s and related technologies have “graph” in their name but do not involve graphs in the direct sense we reviewed here. For example GraphQL, Microsoft Graph API, the (Open) Graph Protocols etc. are various technologies that are indirectly hinting at the growing importance of graph structures.

On the other hand, there are concepts that take mathematical graphs to the next level. For example the concept of a hypergraph defines complex edges that connect sets rather than pairs of nodes. It is thus a generalization of the basic graph construct we explored here and opens up new application areas.

It should also be mentioned that besides PGM and GNN type models there are several more specialized models and algorithms around graph oriented computations: such as Graph Kernels, Random Walks on Graphs etc.


  1. Intoductory Graph Theory by G.Chartrand is an accessible Dover edition that discusses the basics of graph theory ↩︎

  2. Encyclopedic Dictionary of Mathematics ↩︎

  3. C++ Object Oriented Data Structures, Sengupta and Korobkin ↩︎

  4. Knowledge Graphs, A.Hogan et al. 2020 ↩︎

  5. Demystifying Graph Databases: Analysis and Taxonomy of Data Organization, System Designs, and Graph Queries, Peter et al. ↩︎

  6. The opposite direction would also be interesting! ↩︎