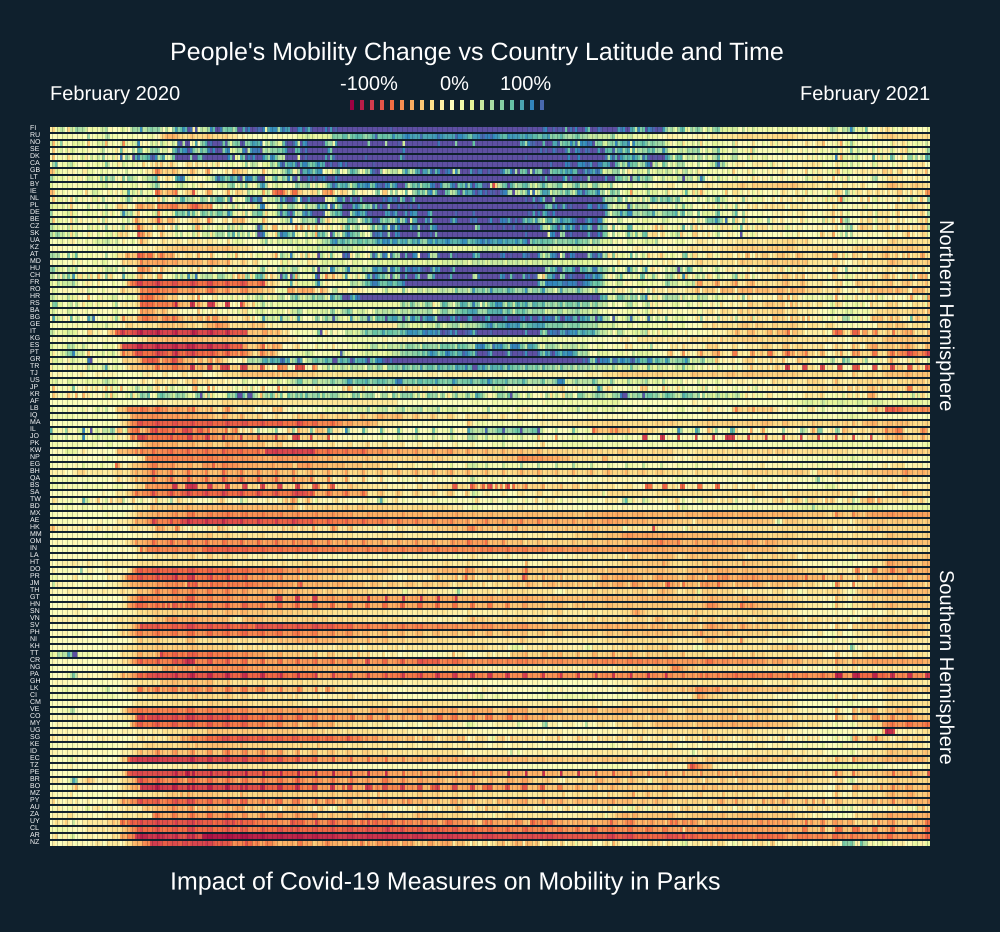
Visualizing a year in lockdowns and restricted mobility As we move into February 2021 the world will be experiencing almost a year under pandemic conditions. This has markedly changed behavioral patterns of human mobility across the board. One major difference with previous pandemics is that through the use of a variety of digital technologies and new data collection channels we know have an unprecedented view of those changing mobility patterns.
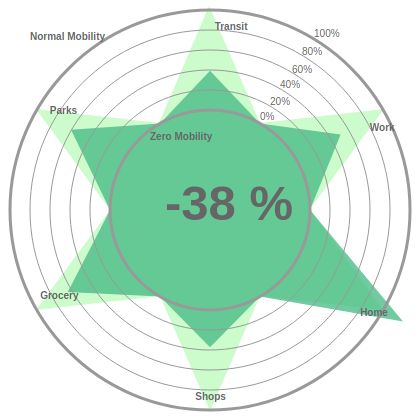
We introduce a global mobility index that averages Google mobility data across all available countries (weighting by population) to provide an overall view of how the pandemic has influenced human mobility
Constructing a Global Mobility Index (GMI) In previous posts (here, and here) we introduced new Open Risk Dashboard functionalities that integrate COVID-19 community mobility data (currently focusing on the datasets provided by Google).
As a reminder, these reports chart over time human mobility trends collected from mobile geolocation data. The granularity is by geography and across different categories of places / activities such as retail and recreation areas, groceries and pharmacies, parks, transit stations, workplaces, and residential areas.
The community mobility reports and OpenCPM In a previous post we introduced new OpenCPM functionality that integrates COVID-19 community mobility data (currently from Google). The reports chart movement trends over time by geography, across different categories of places such as retail and recreation, groceries and pharmacies, parks, transit stations, workplaces, and residential.
While these reports are unlikely to persist as open data sources in the long term, the current availability (as of May 2020) enables providing within OpenCPM a mobility data dashboard that can help draw insights through visualization and statistical analysis.
The community mobility reports and OpenCPM As the COVID-19 pandemic unfolded technology providers (most notably Google and Apple) made available to the public aggregated and anonymized data about human mobility in the crisis period (on the basis of smartphone location data). These Community Mobility Reports provide insights into how mobility patterns changed in response both to pandemic news and policies aimed at combating COVID-19.
The reports chart movement trends over time by geography, across different categories of locations and activities, such as retail and recreation, groceries and pharmacies, parks, transit stations, workplaces, and residential.
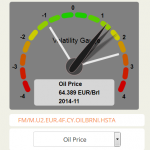
Correlation Radar added to the Dashboard About the Correlation Radar The EU Risk Dashboard is a web app developed by Open Risk to assist with the exploration and understanding of the large number of economic indicators published by the ECB in its Statistical Data Warehouse. The app data are derived from the timeseries available in the Warehouse. Most readings in the currently selected series are monthly or quarterly and are updated when those become available at the Warehouse.
EU Risk Dashboard Released About the app The EU Risk Dashboard is a web app developed by Open Risk to assist with the exploration and understanding of the large number of economic indicators published by the ECB in its Statistical Data Warehouse. The app data are derived from the timeseries available in the Warehouse. Most readings in the currently selected series are monthly and update automatically when those become available at the Warehouse.
The Stress Test Explorer is a web app developed by Open Risk to assist with the exploration and understanding of the large number of results published by the European regulatory authorities (ECB/EBA) in connection with the 2014 Comprehensive Assessment exercise. The app is now live and freely accessible here.
Please note: The app is requires a modern browser to display graphics
In line with the beta testing status of the entire Open Risk website, this app may evolve, subject to user comments and feedback.
RegNews, the Regulatory News Aggregator With all the ongoing activity around financial regulation having a convenient aggregation point for the main news is an indispensable tool for financial risk managers. This prompted us to build and roll out the Regulatory News App (RegNews in short), which is now live and freely accessible here. The app is designed to be usable both on a desktop and mobile environment.
In line with the beta testing status of the entire Open Risk website, this app will evolve, subject to user comments and feedback!