16, Random Walks on Supply and Use Graphs
Open Risk White Paper 16: Follow the Money: Random Walks on Supply and Use Graphs
We explore how to organize Environmentally-Extended Input-Output frameworks (EEIO), and in particular their Supply and Use Table (SUT) formulation, as graphs. Working directly with SUT systems instead of converting to symmetric IO matrices involves fewer assumptions and (in principle) higher resolution in expressing environmental impacts. We elaborate first on the representation of SUT tables as directed, weighted bipartite graphs. We discuss both closed (circular) and open system configurations, featuring source and sink nodes. These are modeled as regular and absorbing Markov Chains respectively. We outline a probabilistic random walk framework that realizes mathematically the colloquial Follow the Money concept. This enables computing a range of various existing and new metrics using the EEIO data. As an illustration, besides the standard environmental footprint metric, we introduce the concept of footprint variance or the intrinsic variability of estimates. We illustrate the overall setup using a classic numerical example from the EEIO literature.
Structure of the White Paper
Introduction
Environmental impacts, how they can be measured (accounted for) and, importantly, how they can be attributed to human actors is a central aspect of mitigation actions pursued at various levels. Sufficiently accurate, complete and trusted measurement and reporting of environmental impact is a prerequisite for the sustainability transition. Equally important is a transparent, logical, fair and effective attribution that will incentivize the economic actors optimally placed to support the transition.
Further, when addressing the environmental impact from complex interlocked production and consumption activities and supply chains, crucial questions arise such as: who is responsible and how is that responsibility to be attributed more precisely? Formal, transparent, comprehensive, mandatory etc. mechanisms of establishing and communicating responsibility are part of the toolkit towards the broader sustainability transition, but there are both conceptual questions and more practical challenges.
In the Introduction section we place the white paper in the context of contemporary developments around Environmentally-extended Input-Output frameworks, and in particular their use in environmental impact attribution, known as footprinting and related methodologies. We discuss the role of mathematical tools such a graph theory and Markov Chains in this context. We motivate the study of SUT systems as more general and with fewer assumptions than classic symmetric IO systems.
Section 2: Supply and Use Data as Graphs.
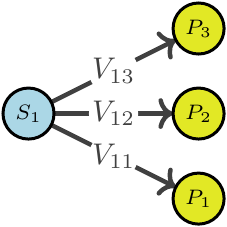
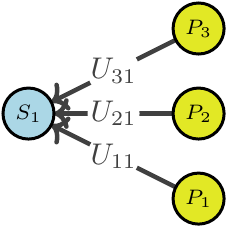
We elaborate in this section on the representation of SUT tables as directed, weighted bipartite graphs. We define all necessary terms and introduce the needed notation, both the graph-theoretic part and the associated matrix algebra.
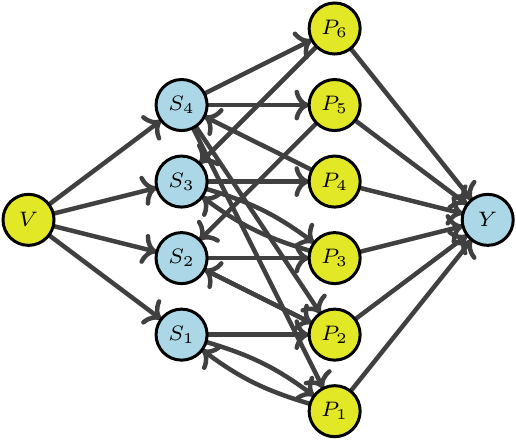
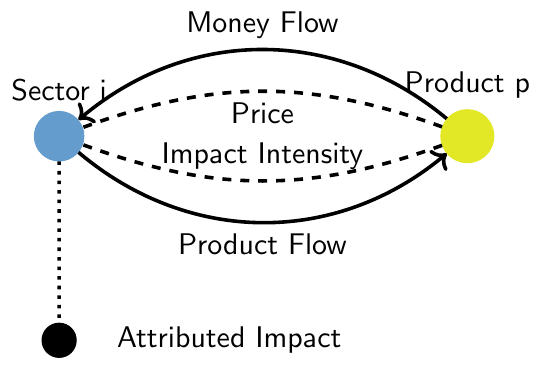
While graph representations of input-output systems are not uncommon, this is less so for SUT systems. We make the connection between numerical SUT data and graph properties and functions. We discuss the nature of Sector and Product market nodes and the linkage of various numerical data. Central role is played the weighted adjacency matrix constructed from the Supply and Use tables and of course the environmental impact inputs (absolute and intensities).
We discuss both closed (circular) and open system configurations, featuring source and sink nodes. The relevant connectivity properties of the graph are expressed in terms of in and out-degree matrices for the two types of nodes.
Section 3: Probabilistic Interpretations and Random Walks.
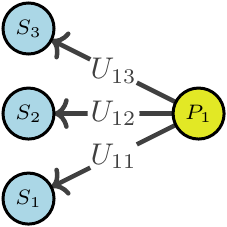
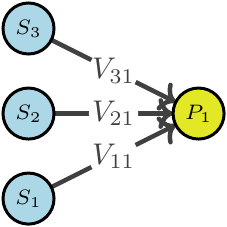
We outline next a probabilistic random walk framework that realizes mathematically the colloquial Follow the Money concept. Starting from the input weight matrix we look at balanced matrix properties and the creation of stochastic (probabilistic) transition matrices.
$$ Q = \begin{bmatrix} 0 & 0 & \cdots & 0 & u_{11} & u_{12} & \cdots & u_{1n} \\ 0 & 0 & \cdots & 0 & u_{21} & u_{22} & \cdots & u_{2n} \\ \vdots & \vdots & \ddots & \vdots & \vdots & \vdots & \ddots & \vdots & \\ 0 & 0 & \cdots & 0 & u_{m1} & u_{m2} & \cdots & u_{mn} \\ v_{11} & v_{12} & \cdots & v_{1m} & 0 &0 & \cdots & 0 \\ v_{21} & v_{22} & \cdots & v_{2m} & 0 &0 & \cdots & 0 \\ \vdots & \vdots & \ddots & \vdots & \vdots & \vdots & \ddots & \vdots \\ v_{n1} & v_{n2} & \cdots & v_{nm} & 0 &0 & \cdots & 0 \\ \end{bmatrix} $$
Using these we can model both regular and absorbing Markov Chains. This enables using standard tools such as the forward Kolmogorov equation and conditional expectations to compute a range of various existing and new metrics using the EEIO data.
$$ \mathbb{E}(F(t)) = \sum_k \sum_l f_{kl} Q^{t}_{kl} P_l(0) = f \circ Q^t \cdot P(0) $$
As an illustration, besides the standard environmental footprint metric, we introduce the concept of footprint variance or the intrinsic variability of estimates.
Appendix: Worked Out Example
Finally, in the Appendix we illustrate the framework with a worked example. We go through the flow of calculations using a classic numerical example from the EEIO literature.
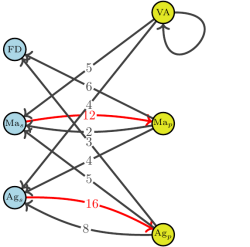
This is a simple system with two industrial sectors and a household sector. We convert it into a bipartite SUT graph and illustrate the key building blocks. Using that numerical data input we go step by step though the probabilistic calculation of expected environmental impact and its variance.
Download
Citation
@ARTICLE{OpenRiskWhitePaper16,
 author = {P. Papadopoulos},
 year = {2024},
 note = {\href{https://www.openriskmanagement.com/post-media/2024/12/OpenRiskWP16_161224.pdf}{Download URL}},
 title = {{Open Risk WP16: Follow the Money: Random Walks on Supply and Use Graphs}},
 journal = {Open Risk White Papers}
}
Comment
If you want to comment on this post you can do so on Reddit or alternatively at the Open Risk Commons. Please note that you will need a Reddit or Open Risk Commons account respectively to be able to comment!