Exploring Ten Years of FOSDEM talks
We look into ten years of FOSDEM conference data to start getting to grips with the open source phenomenon and also explore techniques for data review and exploratory data analysis using (of course) open source python tools. In the process we identify the imprint of the pandemic on attendance, the longest ever title, the distribution of mindshare of time and some notable newcomers.
FOSDEM is a non-commercial, volunteer-organized, two-day conference celebrating free and open-source software development. The conference has a geographic focus on European open source ecosystems and projects. FOSDEM is primarily aimed at developers, across the entire range of software and aims to enable them to meet and discuss the status of projects.
We look into ten years of FOSDEM conference data to start getting to grips with the open source phenomenon and also explore techniques for data review and exploratory data analysis using (of course) open source python tools. In the process we identify the imprint of the pandemic on attendance, the longest ever title, the distribution of mindshare of time and some notable newcomers.
Some background about the FOSDEM conference
FOSDEM is held annually since 2001, usually during the first weekend of February, at the Université Libre de Bruxelles Solbosch campus in the southeast of Brussels, Belgium. The history of FOSDEM is neatly available at Wikipedia including a list of seminal keynote presentations. The current conference (2022) website is available here and the upcoming weekend (5 & 6 February 2022) promises to be another celebration for open source!
FOSDEM is nowadays a large event. It spans 2 days, may attract 8K+ participants and include of the order of 800 distinct activities. This makes it a reasonable snapshot of the current state of the open source universe (or at least its European footprint).
As befits an open source conference event, there is already a decade’s worth of conference data available. Our objective in this post is to explore this dataset to see what kind of knowledge we might be able to glean about the development of the FOSDEM conference (and by implication) of the open source movement. A secondary objective is to illustrate the basic sequences of data review1 and exploratory data analysis2 in what is hopefully a more fun and less formal context.
The FOSDEM conference data
The first task of a data review process is to get access to the… data. The data of the conference schedules since 2012 are available in xml format at the address https://fosdem.org/20XX/schedule/xml, where XX is the year. In human readable form the same data are presented here.
We can get the files in various ways3, for example using the GNU Wget software package. As there are ten files we can save some time by running a script like:
#!/bin/bash
DATADIR="data"
for i in {2012..2022..1}
do
  FROM=https://fosdem.org/$i/schedule/xml
  TO=$DATADIR/fosdem$i.xml
  wget  $FROM -O $TO
done
The pentabarf data schema
The xml format of the dataset is the pentabarf schema used by the open source conference scheduling software of that name. Pentabarf is a conference planning software written in Ruby (using the Rails framework) and PL/pgSQL. Pentabarf supports the submission collection, content planning, schedule creation, feedback collection and has various exports to put these data to use in other systems. The choice of name is rather obscure4 but a friendly beginners guide to the system is available here.
Each annual conference data file is a distinct XML file which if opened in any text editor confronts us with the following structure:
<schedule>
    <conference></conference>
    <day>
        <room>
            <event>
                <start></start>
                <duration></duration>
                <room></room>
                <slug></slug>
                <title></title>
                <subtitle></subtitle>
                <track></track>
                <type></type>
                <language></language>
                <abstract></abstract>
                <description></description>
                <links></links>
                <persons>
                    <person id="XXXX">XXXX XXXX</person>
                </persons>
            </event>
        </room>
    </day>
</schedule>
Looking at this XML structure and the tag names of the XML elements their meaning is sort of “evident”. This is the point where in a formal data review alarm bells should be ringing. Namely, it is important to have documented the precise meaning of the entries specified so that one can be assured, for example, that data have been entered correctly, our further analyses and inferences are justified etc.5
For our purposes we note that the schedule of conference is captured as a nested dictionary: starting with conference days, then rooms, then events (talks or other activity) which is for our purposes the principal object and unit of analysis. Something we note immediately is that we will not be concerned with the entire data set. For example, in this type of retrospective statistical analysis, we are not interested in precise room information (even though it is obviously quite vital data when the conference is live). We also skip personal data (names). Finally. the links (to videos and other supporting material) are obviously where the actual recorded content of the conference is to be found but analysing that is outside our scope.
Isolating the interesting features
Out of that rich collection of information we isolate the following features as “interesting”:
   event_data = {
       'year': the year of the conference
       'duration': the duration of the activity in minutes
       'track':  the category under which the activity has been sloted
       'abstract': presentation abstract
       'title': presentation title
       'description': presentation description,
       'video': whether there is a video link
       'slides_url': whether there is slides link
       'audio_url': whether there is an audio link
       'persons': the number of persons credited for the activity
   }
The relevant for us part of the data structure involves some date / numerical fields such as “year”, or “duration”, and several text fields such as “title”, “description”, “abstract” etc. How do we extract these bits from the xml files? Luckily, there is a dedicated open source pentabarf parser that can help us parse the event data rather than having to write an XML parser from scratch.
Next, using pandas these ten conference xml files can be readily merged into a Master Data Table that focuses on the event data of interest.6
Descriptive Statistics
So what have we got? In the first instance we note that the size of the master data table if saved in CSV format is ~8MB. The cumulative description of a decade’s worth of open source conference events is definitely not big data! 7. Using the convenient pandas dataframe describe method we get the following overall picture in terms of Descriptive Statistics . NB: one can only run descriptive statistics for numerical fields.
- 7126 distinct talks/activities over the 10-year period spanned by the dataset
- The average duration of an activity is 33 minutes
- The shortest duration is 5 minutes
- The longest recorded duration is a 540 minutes long talk aiming to settle the Amiga vs Atari debate8
- The typical talk is authored by 1 person. The largest number of persons associated with an event is 99
- On average 66% | of talks have a video link (NB: 2022 links not uploaded yet as of posting time)
- 2% | of presentations have a presentation URL (for slides)
- Very, very few events have an audio link, likely reflecting both how information if conveyed visually and the fact that video includes audio.
- The longest ever title is a 2022 talk in the Web3 Infrastructure track: Peergos - Combining peer-to-peer connectivity, end-to-end encryption and fine grained access control to build a secure and privacy focused self-certifying web protocol.
- For the crown of the shortest title we have a tie of two talks that use two-letter acronyms as title: XR and GT.
Evolution of FOSDEM activity over time
An important characteristic of our dataset is that it offers 10 distinct sets of observations. This leads naturally to Time Series Analysis and questions like: How does the number of talks evolve over time? We can explore that easily using pandas’ groupby function (counting the talks in each year) and then plotting the time series, e.g., using the seaborn package.
# create a barplot of event count over time
ax = sns.barplot(x="year", y="track", data=res)
#specfiy axis labels
ax.set(xlabel='Year',
       ylabel='Talks',
       title='Number of FOSDEM Talks over Time')

The growing trend in activity is obvious (more than doubling from 2012 to 2020!).
There is also a noticeable decline in the last two years. But is it really a decline? As a classic pattern in Exploratory Data Analysis, we need to check if that “picture” is corroborated by other statistics. While the number of registered events is an obvious indicator of activity, let us also look at the number of total event minutes:

We see that in terms of total minutes, 2021 was actually the year of the most FOSDEM activity. This suggests that if one wanted to track activity more accurately it would definitely be worthwhile to look at various metrics, possibly also outside this dataset, for example by checking the number of rooms utilized etc. This would be referred to as Level 3 Data Validation .
Finally, let us look at how the number of tracks has evolved as the number of talks has increased:

We see that in general the number of distinct tracks grows in sync with the number of talks, with the last years (2021, 2022) being an exception where quite a few more tracks have been introduced.10
But what are people talking about at FOSDEM?
To really know what people talk about at FOSDEM one needs of course to attend (or as a second best, to watch the videos)! But for a summary, “bird’s eye view” we could look into the text contained in the track names, titles, abstracts and descriptions. This is so-called unstructured data and it will need further computational tools to perform. Continuing with a tradition we started in a previous year we will attempt to get a glimpse at what the open source community is talking about.
One can interpret the above question in various ways. One way is to try to identify keywords. Words that signal a specific topic of interest and which are recognized by the community.
Data and Methodology
To get an overview of what keywords are “cross-cutting” (mentioned by multiple projects / presentations) at FOSDEM we will use the text contained in the conference schedule as follows:
- The text attributes for all distinct events are concatenated11
- The cumulated text of each talk is pre-processed using NLTK to extract unique keywords used within each talk.
- Once this filtering is done, we look at the frequency with which unique keywords occur across multiple talks.
- Each keyword is thus assigned a frequency of occurrence across the conference. This controls for any speaker being particularly fond and loquacious in their use of a particular keyword in any particular abstract / description!
- To avoid spurious accuracy the frequency is rounded to no decimal digits.
The distribution of keywords has a very long tail nature. This reflects the vast universe of projects and interests of the open source community. This translates into most of the thousands of unique keywords receiving less that 1% | mention.
Most Common FOSDEM Nouns
Tokenizing and tagging nouns with nltk we extract 246660 nouns in total, distributed over years as follows:
[10804, 12679, 15935, 19425, 23062, 24554, 27101, 28737, 35601, 24692, 24070]
Sorting all the nouns by frequency we get the following top-twenty nouns (across all years).
| Noun | Frequency |
|---|---|
| talk | 5449 |
| software | 4013 |
| source | 3700 |
| project | 3146 |
| code | 2480 |
| system | 2412 |
| development | 1946 |
| I | 1932 |
| community | 1813 |
| time | 1578 |
| application | 1465 |
| language | 1330 |
| hardware | 1319 |
| way | 1301 |
| performance | 1300 |
| network | 1268 |
| design | 1267 |
| presentation | 1250 |
| use | 1222 |
| management 1131 |
Scanning the list one would most likely say there aren’t any major surprises. The talk is about talks, and software and projects and coding as one would expect. The pronoun I appears fairly frequently, but community is not far behind. Performance beats design but only barely.
Within the list of all nouns we can try to find named technologies. It turns out that any concrete such names are not particularly frequent, the open source ecosystem is fairly diversified. The top ten is as follows (again the cumulative over the decade)
| Noun | Frequency |
|---|---|
| linux | 892 |
| python | 763 |
| java | 643 |
| mysql | 504 |
| libreoffice | 456 |
| apache | 340 |
| javascript | 323 |
| gnu | 265 |
| arm | 260 |
| llvm | 254 |
A lot of usual suspects show up in the top-ten12. In terms of the eternal language wars (comparing also with the 2020/2021 standing) it is evident that python, java and javascript are pretty popular also taking this much longer period into account.
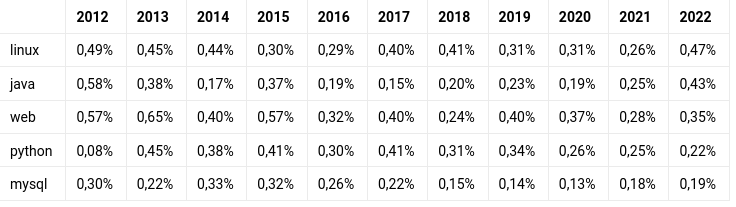
Frequency of selected nouns over time
We finally look into how the frequency of occurrence of certain nouns has evolved over time. In order for the comparison across years to be meaningful we must normalize with the total activity per year (as measured by the total noun count for a given year). The result is a short of FOSDEM mindshare for any given year.
| 2012 | 2013 | 2014 | 2015 | 2016 | 2017 | 2018 | 2019 | 2020 | 2021 | 2022 | |
|---|---|---|---|---|---|---|---|---|---|---|---|
| linux | 0,49% | 0,45% | 0,44% | 0,30% | 0,29% | 0,40% | 0,41% | 0,31% | 0,31% | 0,26% | 0,47% |
| java | 0,58% | 0,38% | 0,17% | 0,37% | 0,19% | 0,15% | 0,20% | 0,23% | 0,19% | 0,25% | 0,43% |
| web | 0,57% | 0,65% | 0,40% | 0,57% | 0,32% | 0,40% | 0,24% | 0,40% | 0,37% | 0,28% | 0,35% |
| python | 0,08% | 0,45% | 0,38% | 0,41% | 0,30% | 0,41% | 0,31% | 0,34% | 0,26% | 0,25% | 0,22% |
| mysql | 0,30% | 0,22% | 0,33% | 0,32% | 0,26% | 0,22% | 0,15% | 0,14% | 0,13% | 0,18% | 0,19% |
We see that in general there is a fair amount stability and (as mentioned already) substantial diversity in the topics being discussed.
Some Notable Newcomers
The most visible 2022 newcomer (in terms of noun count!) is Fuzion, aka: A New Language For The OpenJDK Unifying Java’s Concepts that makes a solid debut this year.
The Matrix platform, the Kotlin language ecosystem and the MariaDB database are other projects that were barely known at the beginning of the dataset but are now well represented.
Curious to dig more facts out of the FOSDEM conference dataset? You can work directly with an xlsx sheet available here
Disclaimers
Well, there are many disclaimers, some of them have been discussed already in the Notes, but this blog post is not meant to be an academic diatribe but to highlight the vibrancy and fun of the open source world (and FOSDEM in particular). So we leave it at that!
Notes and References
-
Academy Course: Introduction to Risk Data Review ↩︎
-
Academy Course: Exploratory Data Analysis ↩︎
-
We will use the tools of the python ecosystem to explore the data. Code snippets are sprinkled liberally, at this point they are not quite worth creating a new repository for. ↩︎
-
Apparently “The PENTABARF was discovered by the hermit Apostle Zarathud in the Fifth Year of The Caterpillar” ↩︎
-
Further aspects we leave aside are: the domain of Data Provenance , which denotes the documentation of the chronology (timeline) of data ownership and any data transformations or modifications applied to a data set and Data Integrity Validation which is the process of analysing a data set in order to establish certain aspects of Data Quality. ↩︎
-
Why pandas and not a package like numpy or scikit-learn. This has to do with the state of the data at this stage (e.g., unclear data types) which requires various further steps of data processing (data wrangling) to bring to a quantitatively usable state. ↩︎
-
Including the presentations in video form would of-course significantly expand the size of the data set. ↩︎
-
Well, that is actually just a joke. Included in the schedule are various workshops, hackathons, devrooms, certification sections etc. that may span the whole day. The longest actual talk appears to be 90 minutes. ↩︎
-
Again, events with large number of authors are mostly devrooms, panel discussions and similar collective activities. The largest number credited in an actual presentation seems to be three. ↩︎
-
Here we have an example of either a regime change (a new type of activity that does not fit previous patterns) or a data interpretation issue that is linked to the data collection mechanism ↩︎
-
This step loses some information, in the sense that keywords present in titles might be thought of carrying different weight versus in the abstract. ↩︎
-
It is entirely possible that staple technologies (such as e.g. C/C++) have been missed in the tokenization process. This would be an example where data processing introduces its own conscious or unconsious biases. ↩︎