Credit Portfolio PnL volatility under IFRS 9 and CECL
Credit Portfolio PnL volatility under IFRS 9 and CECL
Objective
We explore conceptually a selection of key structural drivers of profit-and-loss (PnL) volatility for credit portfolios when profitability is measured following the principles underpinning the new IFRS 9 / CECL standards
Methodology
We setup stylized calculations for a credit portfolio with the following main parameters and assumptions:
- A portfolio of 200 commercial loans of uniform size and credit quality
- Maturities extending from one to five annual periods
- A stylized transition matrix producing typical multiyear credit curves
- Correlation between assets typical for a single business sector and geography portfolio
- Focusing on PnL estimates one year forward, with PnL being impacted both by Realized Losses
(defaults) and Provision variability (both positive and negative).
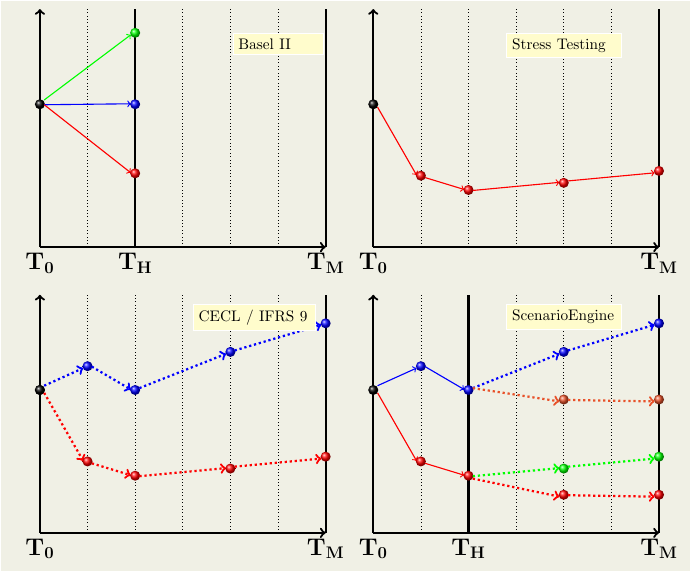
We use an advanced credit portfolio simulation module available in the OpenCPM platform to construct scenarios following a root and branch approach (or scenario within scenario).
- Each simulation of macroeconomic and portfolio specific factors proceeds up until the one year time point (Capital management horizon). We denote this as a Root Scenario
- Realised losses up to the one year time point are recorded
- A number of additional (Branch Scenarios) explore the different possible realizations of macroeconomic and portfolio specific factors to the future of the one-year time point
- The credit state of each loan for each branch scenario up until maturity or default (which-ever comes first) is recorded
- Branch scenario losses are discounted back to the Year 1 time point to estimate Expected Credit Loss
- ECL and Realized Loss are combined to produce the total PnL estimate one year forward
- Statistical distributions of ECL and Loss variability are estimated Schematically this setup is described in Panel 4 of the next figure
Transition Matrix
A typical annual transition matrix is taken as input for the analysis. Multi-period Default Curves for the five year study are obtained using convolution of the annual matrix
| AAA | AA | A | BBB | BB | B | C | D | |
|---|---|---|---|---|---|---|---|---|
| AAA | 0.92039 | 0.0709 | 0.0063 | 0.0015 | 0.0006 | 0.0002 | 0.00010 | 0.00001 |
| AA | 0.00620 | 0.9084 | 0.0776 | 0.0059 | 0.0006 | 0.0010 | 0.00020 | 0.00010 |
| A | 0.00050 | 0.0209 | 0.9138 | 0.0579 | 0.0044 | 0.0016 | 0.00040 | 0.00050 |
| BBB | 0.00040 | 0.0021 | 0.0410 | 0.8936 | 0.0482 | 0.0086 | 0.00240 | 0.00370 |
| BB | 0.00030 | 0.0008 | 0.0140 | 0.0553 | 0.8225 | 0.0815 | 0.01110 | 0.01450 |
| B | 0.00010 | 0.0004 | 0.0057 | 0.0134 | 0.0539 | 0.8114 | 0.04920 | 0.06590 |
| C | 0.00001 | 0.0002 | 0.0029 | 0.0058 | 0.0155 | 0.1054 | 0.52879 | 0.34140 |
| D | 0.00000 | 0.0000 | 0.0000 | 0.0000 | 0.0000 | 0.0000 | 0.00000 | 1.00000 |
Results
We present here an overview of the parametric study. In each calculation we calculate the PnL standard deviation one year forward and its decomposition into ECL component and Realized Component. For the portfolio with 1 year maturity there is obviously no contribution from ECL variability as all credit assets have matured by the horizon (we do not consider replacement)
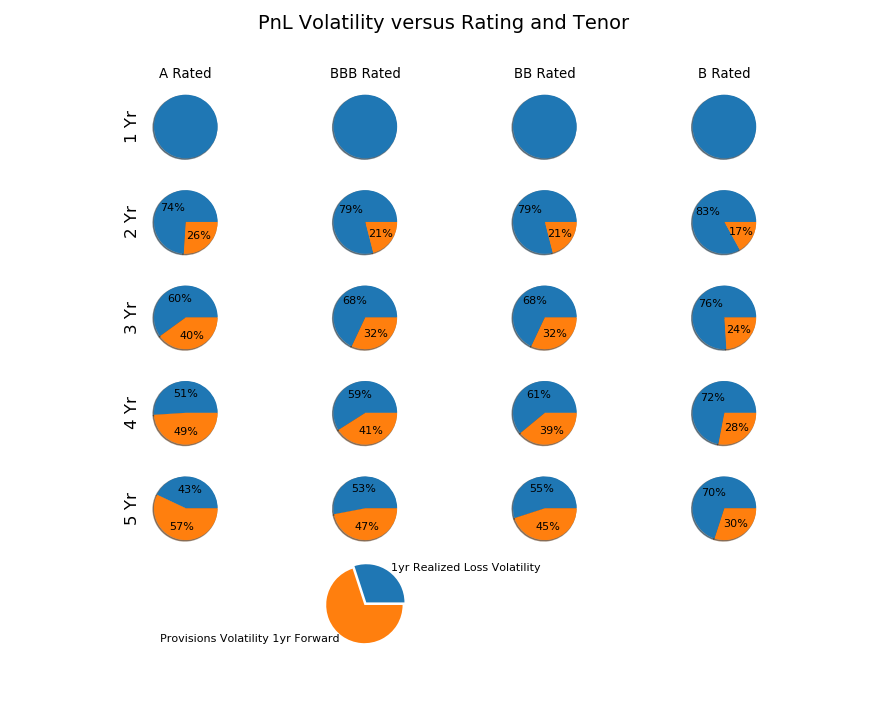
Discussion
We note several interesting aspects in the results:
- ECL variability is a material factor in PnL variability for all rating classes and tenors
- Tenor is a stronger driver than rating (in terms of sensitivity of volatility contributions)
- Long tenor / better quality asset PnL may be largely dominated by ECL volatility
Next Steps
In future posts we will be using the OpenCPM platform to explore further assumptions of the IFRS 9 / CECL frameworks. IFRS 9 in particular introduces the three Stages concept which can materially affect the volatility of various pools of assets