Comparing IFRS 9 and CECL provision volatility
Is the IFRS 9 or CECL standard more volatile? Its all relative
Objective
In this study we compare the volatility of reported profit-and-loss (PnL) for credit portfolios when those are measured (accounted for) following respectively the IFRS 9 and CECL accounting standards.
The objective is to assess the impact of a key methodological difference between the two standards, the so-called Staging approach of IFRS 9. There are further explicit differences in the two standards. Importantly, given the standards are not prescriptive, it is very likely that there will be material differences in interpretation and implementation of the principles (for example on the nature and construction of scenarios). In this study we perform a controlled comparison adopting a ‘ceteris-paribus’ mentality: We assume that all other implementation details are similar and we focus on the impact of the Staging approach.
Methodology
We setup stylized PnL calculations for a credit portfolio with the following main parameters and assumptions:
- A portfolio of 100 bullet-type commercial loans of uniform size and credit quality
- A homogeneous initial maturity profile extending to four annual periods. No amortisation or optionality for further draw-downs.
- A ratings-based credit migration matrix which governs both credit quality deterioration and the multiyear credit default curves
- A simple macro model for the development of the economy (as it impacts this credit portfolio). The model effectively imposes a credit migration correlation between credit assets that is typical for a portfolio covering a single business sector and geography
To analyse PnL volatility we choose to estimate PnL one year forward. This is a convention that is in line with annual capital management cycles. This future PnL is being impacted both by Realized Losses (defaults) within the year and Provision Variability due to changes in credit-worthiness (both positive and negative). That change in credit-worthiness will have both systematic (portfolio-wide) and idiosyncratic factors
We use an advanced credit portfolio simulation module available in the OpenCPM platform to construct scenarios following a root and branch approach (or scenarios within scenarios). Adopting this methodology allows us to avoid making Perfect foresight assumptions. This works as follows:
- Each simulation of macroeconomic and portfolio specific factors proceeds up until the one year timepoint (Capital management horizon). We denote this as a Root Scenario
- We record any realized losses up to the one year timepoint
- We explore a number of additional (Branch Scenarios) that follow the different possible realizations of macroeconomic and portfolio specific factors to the future of the one-year timepoint
- For each branch scenario, we record the credit state of each loan up until maturity or default (which-ever comes first)
- Branch scenario losses are discounted back to the Year 1 timepoint to estimate Expected Credit Loss
- Both Cumulative (Lifetime) ECL (CECL) and 1yr forward ECL are computed, thus enabling to emulate both CECL and IFRS 9 setups (more on the IFRS 9 emulation below)
- The applicable Provision and Realized Loss estimates are combined to produce the total PnL estimate one year forward
- Statistical distributions of that PnL are estimated (and hence key statistical moments such as the average PnL and its standard deviation
IFRS 9 versus CECL Measurements
The CECL provision methodology is based on the forward LECL estimate as indicated above. It is worth highlighting that the forward CECL change is assumed to driven entirely by dynamic factors - that is, we assume that the static creditworthiness characteristics of the borrower remain the same. For example the borrower does not change within the calculation horizon their leverage by additional borrowing and they do not modify their asset volatility by changing their business model. The borrower is thus effectively re-rated in future periods by monitoring the development of their dynamically evolving asset base versus the fixed leverage.
The IFRS 9 methodology requires additional assumptions about the (internal) procedure followed by the reporting entity for assigning initial and ongoing Stage classifications (State 1, 2, or 3) to the portfolio assets.
We implement the following algorithm as a proxy:
- Initially all assets are starting in Stage 1.
- Assets exhibiting a default within the fist year become Stage 3 assets and are assumed resolved immediately (no further PnL impact). For simplicity we assume 100% LGD.
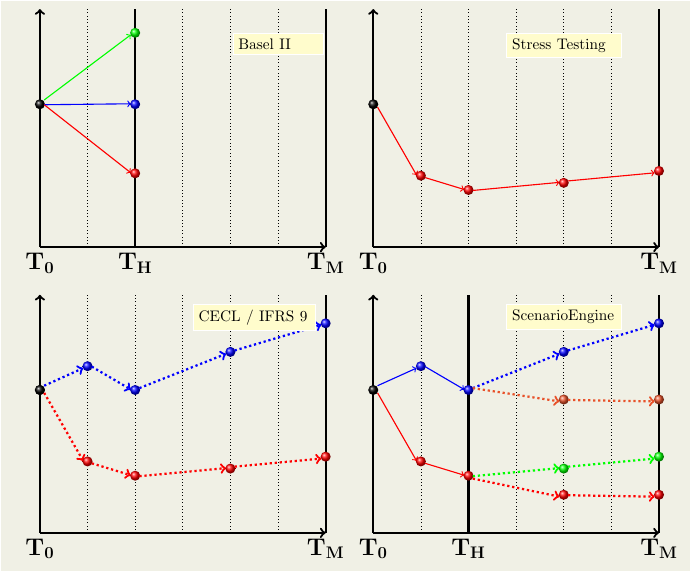
- Assets deteriorating in credit worthiness within the first year may migrate from Stage 1 to Stage 2. We use 1, 2 or 3 rating level migrations as the threshold for re-assigning to Stage 2. This emulates policies of different aggressiveness. Schematically our computational setup is described in Panel 4 of the next figure. The setups of other major current conceptual frameworks are indicated as well, for juxtaposition of the new elements
Credit Migration Matrix and Multiperiod Credit Curves
A typical annual transition matrix is taken as input for the analysis. The portfolio is assumed to be, initially, homogeneous in one of the rating states (we will vary that initial assignment to assess at a high level the sensitivity of IFRS 9 / CECL volatility differences to credit quality.
| AAA | AA | A | BBB | BB | B | C | D | |
|---|---|---|---|---|---|---|---|---|
| AAA | 0.92039 | 0.0709 | 0.0063 | 0.0015 | 0.0006 | 0.0002 | 0.00010 | 0.00001 |
| AA | 0.00620 | 0.9084 | 0.0776 | 0.0059 | 0.0006 | 0.0010 | 0.00020 | 0.00010 |
| A | 0.00050 | 0.0209 | 0.9138 | 0.0579 | 0.0044 | 0.0016 | 0.00040 | 0.00050 |
| BBB | 0.00040 | 0.0021 | 0.0410 | 0.8936 | 0.0482 | 0.0086 | 0.00240 | 0.00370 |
| BB | 0.00030 | 0.0008 | 0.0140 | 0.0553 | 0.8225 | 0.0815 | 0.01110 | 0.01450 |
| B | 0.00010 | 0.0004 | 0.0057 | 0.0134 | 0.0539 | 0.8114 | 0.04920 | 0.06590 |
| C | 0.00001 | 0.0002 | 0.0029 | 0.0058 | 0.0155 | 0.1054 | 0.52879 | 0.34140 |
| D | 0.00000 | 0.0000 | 0.0000 | 0.0000 | 0.0000 | 0.0000 | 0.00000 | 1.00000 |
Multiperiod Default Curves for a four-year maturity are obtained using convolution of the annual matrix
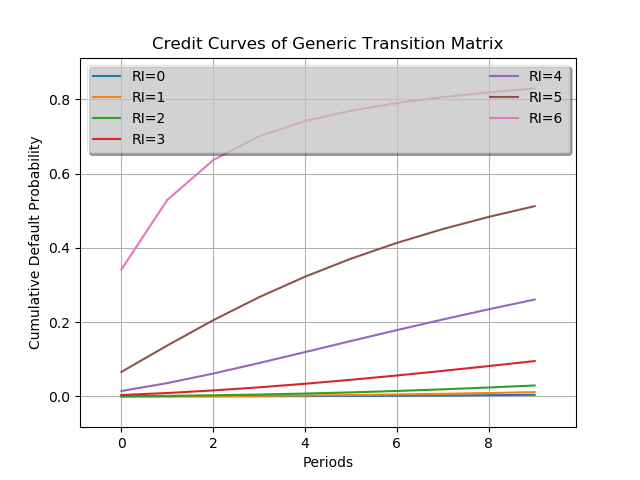
NB: It is well know that the multi-period default curves of credit assets originated at very low credit quality deviate from those obtained by exponentiating short period matrices but they are included here for comparison purposes.
Results
We present here a summary of a parametric study that touches on two key dimensions: The credit quality of the portfolio, which governs the intrinsic credit risk and the calibration of the Staging methodology.
Dependence of IFRS 9 / CECL volatility ratio on initial portfolio credit quality
As indicated in the previous section, in each calculation within the parameter survey we obtain the distribution of losses and forward loss expectations. This yields a very rich set of data - in this blog post we will only highlight some of the features.
The following illustration captures the allocation of the portfolio in the three IFRS 9 Stages for the different simulated scenarios
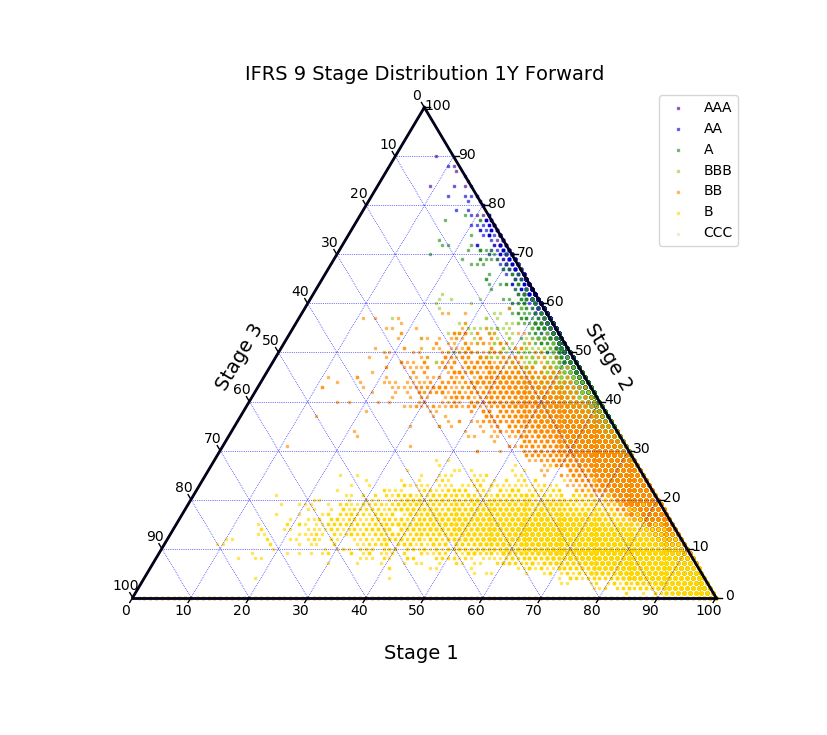
Initially all portfolios start in the lower right corner of the diagram (100% Stage 1, 0% Stage 2 and 0% Stage 3). Each point represents the allocation of exposure to Stages at the 1Y time horizon. As expected we see that in tail scenarios high quality grades primarily migrate to Stage 2 (top corner of the diagram) with relatively fewer realized defaults ( Stage 3). Lower credit qualities cumulate in adverse scenarios towards the Stage 3 corner (left side), with the most extreme example being the CCC category for which the distinction between Stage 1 and Stage 2 may not be particularly informative.
From the numerical data we derive the mean and the standard deviation for the following metrics:
- Loss, the realized defaults/loss during the first year
- LECL, the remaining lifetime expected credit loss
- ECL_1Y, the 1 year forward - 1 year expected credit loss (used for IFRS 9 Stage 1 assets)
- PnL_CECL, the PnL under CECL (essentially the sum of LECL and Loss)
- PnL_IFRS9, the PnL under IFRS 9 (the sum of Loss and Stage based provisioning)
- The Ratio of Standard Deviation over Average PnL for both CECL and IFRS 9
| Rating | Loss Mean | Loss Std | CECL Mean | ECL_1Y Mean | CECL Std | ECL_1Y Std |
| AAA | 0.0% | 0.0% | 0.0% | 0.0% | 0.1% | 0.0% |
| AA | 0.0% | 0.1% | 0.1% | 0.0% | 0.2% | 0.1% |
| A | 0.0% | 0.3% | 0.4% | 0.1% | 0.5% | 0.2% |
| BBB | 0.4% | 1.0% | 2.1% | 0.5% | 1.7% | 0.7% |
| BB | 1.4% | 2.6% | 7.5% | 2.1% | 4.0% | 1.8% |
| B | 6.6% | 7.5% | 20.3% | 7.2% | 6.3% | 3.6% |
| CCC | 33.8% | 19.3% | 35.9% | 18.7% | 8.7% | 5.0% |
| Rating | PnL_CECL Mean | PnL_IFRS9 Mean | PnL_CECL Std | PnL_IFRS9 Std | CECL Ratio | IFRS9 Ratio |
| AAA | 0.1% | 0.0% | 0.1% | 0.1% | 2.4 | 4.0 |
| AA | 0.2% | 0.1% | 0.3% | 0.2% | 1.7 | 3.0 |
| A | 0.5% | 0.2% | 0.7% | 0.4% | 1.4 | 2.5 |
| BBB | 2.5% | 1.0% | 2.4% | 1.6% | 1.0 | 1.6 |
| BB | 8.9% | 3.7% | 5.9% | 4.1% | 0.7 | 1.1 |
| B | 26.9% | 13.8% | 11.8% | 10.0% | 0.4 | 0.7 |
| CCC | 69.8% | 52.5% | 13.3% | 17.6% | 0.2 | 0.3 |
Dependence of IFRS 9 / CECL volatility ratio on IFRS 9 Staging methodology
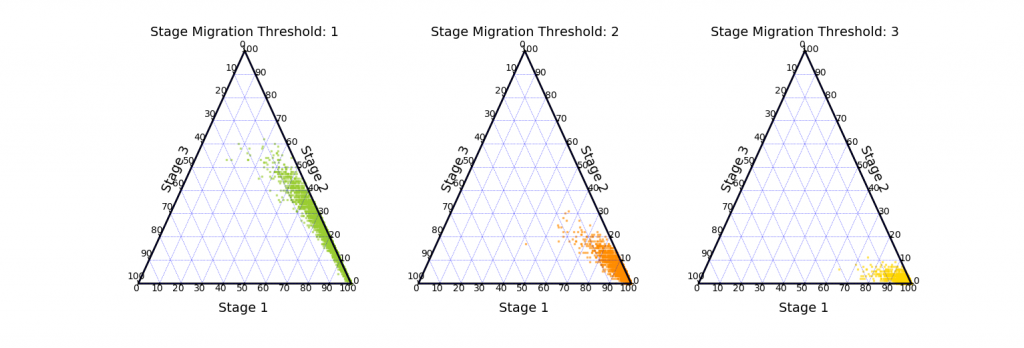
Next, we take a look at the influence of the IFRS 9 Staging methodology on the volatility of reported provisions. In our simplified framework we explore this by varying the number of rating classes (downward) migration that must occur before an exposure initially assigned to Stage 1 is transfered to Stage 2. We use one, two or three rating downgrades.
From the numerical data we derive the mean and the standard deviation for the following metrics:
- PnL_CECL, the PnL under CECL (essentially the sum of LECL and Loss)
- PnL_IFRS9, the PnL under IFRS 9 (the sum of Loss and Stage based provisioning)
- The Ratio of Standard Deviation over Average PnL for both CECL and IFRS 9
| Stage 2 Threshold (Rating Classes) | PnL_CECL Mean | PnL_IFRS9 Mean | PnL_CECL Std | PnL_IFRS9 Std | CECL Ratio | IFRS Ratio |
| 1 | 9.0% | 4.9% | 6.1% | 5.2% | 0.68 | 1.06 |
| 2 | 9.0% | 3.8% | 6.1% | 4.3% | 0.68 | 1.15 |
| 3 | 9.0% | 3.6% | 6.1% | 4.1% | 0.68 | 1.14 |
We see that the methodology does modify the reported PnL volatility (as expected) but the ratio of standard deviation to average is less sensitive to methodology than it is to credit quality (previous table). Visually we can see the impact of the Staging methodology choice in the following diagram
Discussion
It should be already evident from these first analyses that the introduction of IFRS 9 and CECL opens up entire new dimensions of credit portfolio management. We aim to slowly unpeel these in a series of blog posts.
In an earlier post we used the OpenCPM platform to explore general drivers of PnL volatility which characterise * both* IFRS 9 / CECL frameworks. For convenience, a summary of the earlier findings is included here:
- ECL variability is a material factor in PnL variability for all rating classes and tenors
- Tenor is a stronger driver than rating (in terms of sensitivity of volatility contributions)
- Long tenor / better quality asset PnL may be largely dominated by ECL volatility
From the current analysis we can conclude that the implementation details of IFRS 9 methodology (the Staging approach) can have a material impact on the volatility of reported provisions versus the CECL methodology. While the absolute effect is to lower both the quantum of provisions and the absolute level of volatility, it is notable that on a relative basis (that is, relative to the reported provisions, IFRS 9 volatility will be in general higher, with an intricate dependence on credit quality, tenor, staging methodology and potentially other factors).
Comment
If you want to comment on this post you can do so on Reddit or alternatively at the Open Risk Commons. Please note that you will need a Reddit or Open Risk Commons account respectively to be able to comment!