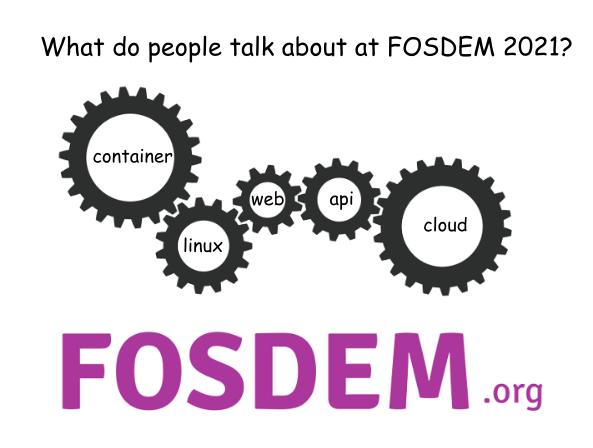
Introduction What is FOSDEM? FOSDEM is a non-commercial, volunteer-organized event centered on free and open-source software development (with a geographic focus on the European open source ecosystems / projects). FOSDEM is aimed at developers and anyone interested in the free and open-source software movement. It aims to enable developers to meet and to promote the awareness and use of free and open-source software.
FOSDEM is held annually since 2001, usually during the first weekend of February, at the Université Libre de Bruxelles Solbosch campus in the southeast of Brussels, Belgium.
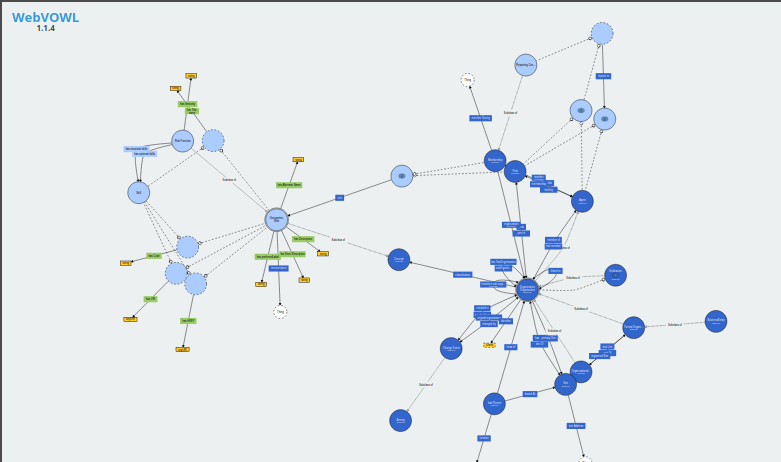
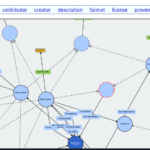
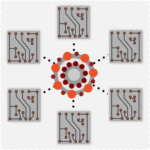
The Risk Function Ontology The Risk Function Ontology is a framework that aims to represent and categorize knowledge about risk management functions using semantic web information technologies. Codenamed RFO codifies the relationship between the various components of a risk management organization. Individuals, teams or even whole departments tasked with risk management exist in some shape or form in most organizations. The ontology allows the definition of risk management roles in more precise terms, which in turn can be used in a variety of contexts: towards better structured actual job descriptions, more accurate description of internal processes and easier inspection of alignement and consistency with risk taxonomies.
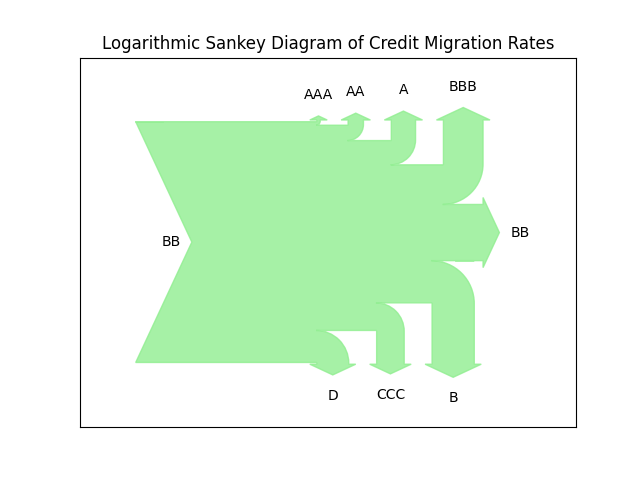
Sankey diagrams are very useful for the visualization of flows, especially when there is a conserved quantity. They can be tricky when some of the flows are much smaller than others. In the latest release of transitionMatrix we include an example of a log-scale version of Sankey
Using Sankey Diagrams Sankey Diagrams are a type of flow diagram composed of interconnected arrows. The width of the arrows is proportional to the flow rate. Sankey diagrams are often used in physical sciences (physics, chemistry, biology) and engineering but also in economics. They can be used to represent the relative role and significance of various inputs and outputs in a given process.
Sankey diagrams emphasize the major transfers within a system.
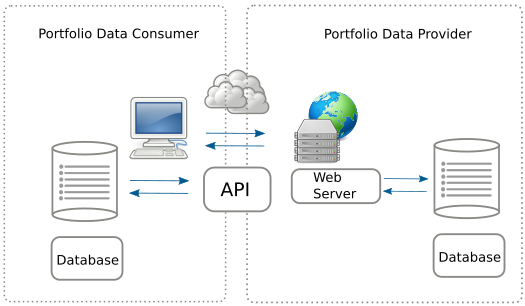
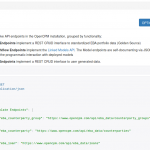
The 0.2 release of openNPL exposes a RESTful API that provides easy standardized online access to NPL credit portfolio data conforming to the EBA NPL templates
openNPL 0.2 release The open source openNPL platform supports the management of standardized credit portfolio data for non-performing loans. In this respect it implements the detailed European Banking Authority NPL loan templates. openNPL aims to be at the same time easy to integrate in human workflows (using a familiar web interface) and integrate into automated (computer driven) workflows.
The latest (0.2) release exposes a REST API that offers machine oriented access using, what is by now, the most established mechanism for achieving flexible online data transfers.
openNPL now Available in Dockerized Form Following up on the first release of openNPL the platform is now available to install using Docker. Running openNPL via docker is the installation option that simplifies the manual process (but a working docker installation is required!).
Docker Hub You can pull the latest openNPL image from Docker Hub (This method is recommended if you do not want to mess with the source distribution).
We explore a variety of distinct ways to visualize the same simple dataset. The post is an excursion into the fundamentals of visualization - a partial deconstruction of the process that highlights some common techniques and associated issues.
Course Objective This course is a deep-dive into the structure of visualizations, in particular visualizations of timeseries data. The course is now live at the Academy.
Pre-requisites Knowledge of basic visualization techniques and mathematical notation of functions and maps. Familiarity with data series and their usage in data science.
Summary of the Course What we aim to achieve in this course is to “deconstruct” how typical and less common visualization of timeseries work.
Non-Performing Loans The covid-19 crisis will certainly impact the concentration of Non-Performing Loans but given the special nature of this economic crisis compared (in particular) with the 2008 financial crisis it is unclear how precisely things will evolve.
In a previous post and white paper (OpenRiskWP07_022616) we discussed the importance of advancing open and transparent methodologies for managing the risks associated with such credit portfolios. Effective management of NPL is also a top regulatory priority.
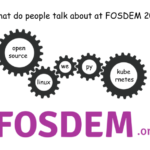
What do people talk about at FOSDEM 2020 Introduction FOSDEM is a non-commercial, volunteer-organized European event centered on free and open-source software development. It is aimed at developers and anyone interested in the free and open-source software movement. It aims to enable developers to meet and to promote the awareness and use of free and open-source software. FOSDEM is held annually since 2001, usually during the first weekend of February, at the Université Libre de Bruxelles Solbosch campus in the southeast of Brussels, Belgium.
Semantic Web Technologies The Risk Model Ontology is a framework that aims to represent and categorize knowledge about risk models using semantic web information technologies.
In principle any semantic technology can be the starting point for a risk model ontology. The Open Risk Manual adopts the W3C’s Web Ontology Language (OWL). OWL is a Semantic Web language designed to represent rich and complex knowledge about things, groups of things, and relations between things.
The motivation for federated credit risk models Federated learning is a machine learning technique that is receiving increased attention in diverse data driven application domains that have data privacy concerns. The essence of the concept is to train algorithms across decentralized servers, each holding their own local data samples, hence without the need to exchange potentially sensitive information. The construction of a common model is achieved through the exchange of derived data (gradients, parameters, weights etc).
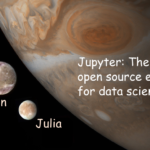
We introduce a side-by-side review of the main open source ecosystems supporting the Data Science domain: Julia, Python, R, the trio sometimes abbreviated as Jupyter
Overview of the Julia-Python-R Universe A new Open Risk Manual entry offers a side-by-side review of the main open source ecosystems supporting the Data Science domain: Julia, Python, R, sometimes abbreviated as Jupyter.
Motivation A large component of Quantitative Risk Management relies on data processing and quantitative tools (aka Data Science ). In recent years open source software targeting Data Science finds increased adoption in diverse applications. The overview of the Julia-Python-R Universe article is a side by side comparison of a wide range of aspects of Python, Julia and R language ecosystems.
Open Source Securitisation Motivation After the Great Financial Crisis securitisation has become the poster child of a financial product exhibiting complexity and opaqueness. The issues and lessons learned post-crisis were many, involving all aspects of the securitisation process, from the nature and quality of the underlying assets, the incentives of the various agents involved and the ability of investors to analyze the products they invested in. While the most egregious complications involved various types of re-securitisation and/or the interplay of structured credit derivatives undoubtedly even vanilla securitisation structure has a considerable amount of business logic.
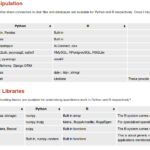
Python versus R Language Motivation for the comparison A large component of risk management relies on data processing and quantitative tools. In turn, such information processing pipelines and numerical algorithms must be implemented in computer systems.
Computing systems come in an extraordinary large variety but in recent years open source software finds increased adoption for diverse applications (machine learning, data science, artificial intelligence). In particular cloud computing environments are primarily based on open source projects at the systems level.
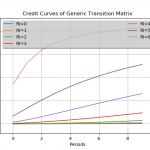
Release of version 0.4.1 of the transitionMatrix package focuses on stressing transition matrices Further building the open source OpenCPM toolkit this realease of transitionMatrix features:
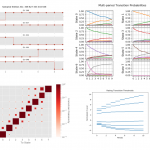
Feature: Added functionality for conditioning multi-period transition matrices Training: Example calculation and visualization of conditional matrices Datasets: State space description and CGS mappings for top-6 credit rating agencies Conditional Transition Probabilities The calculation of conditional transition probabilities given an empirical transition matrix is a highly non-trivial task involving many modelling assumptions.
Release of version 0.4 of the transitionMatrix package Further building the open source OpenCPM toolkit this realease of transitionMatrix features:
Feature: Added Aalen-Johansen Duration Estimator Documentation: Major overhaul of documentation, now targeting ReadTheDocs distribution Training: Streamlining of all examples Installation: Pypi and wheel installation options Datasets: Synthetic Datasets in long format Enjoy!
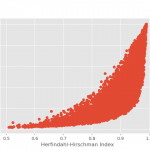
Release of version 0.4 of the Concentration Library adds Geographic / Industrial concentration indexes Further building out the OpenCPM set of tools, we release version 0.4 of the Concentration Library, a python library for the computation of various concentration, diversification and inequality indices.
The below list provides documentation URL’s for each one of the implemented classic indexes (the Hoover index is a new addition in this release)
Atkinson Index Hoover Index Concentration Ratio Berger-Parker Index Herfindahl-Hirschman Index Hannah-Kay Index Gini Index Theil Index Shannon Index Generalized Entropy Index Kolm Index An important new direction that appears first in this release is the introduction of indexes that measure geographical and industrial concentration.
Representing economic activity using pictograms Visualization can produce significant new insights when applied to quantitative data. It is currently undergoing a renaissance that mirrors other developments in computing and data science. Sophisticated open source libraries such as d3.js or matplotlib, to name but a couple, are enabling an ever wider range of users to distill valuable information from the avalanche of data being produced.
Yet when it comes to visualizing data that relate to abstract concepts it can be quite difficult to find an appropriate grammar to express the quantitative context.
Extending the Open Risk API to include the EBA Portfolio Data Templates The Open Risk API provides a mechanism to integrate arbitrary collections of risk data and risk modelling resources in the context of assessing and managing financial risk. It is based on two key technologies of the modern Web, RESTful architectures and Semantic Data.
OpenNPL, the credit portfolio management platfrom we launched recently fully integrates the latest versions of the Open Risk API.
Release of version 0.3 of the ConcentrationMetrics Library Further building out the OpenCPM set of tools, we release version 0.3 of the ConcentrationMetrics Library. This python library for the computation of various concentration, diversification and inequality indices.
The below list provides documentation URL’s for each one of the implemented indexes
Atkinson Index Concentration Ratio Berger-Parker Index Herfindahl-Hirschman Index Hannah-Kay Index Gini Index Theil Index Shannon Index Generalized Entropy Index Kolm Index The image illustrates a simple use of the library where the HHI and Gini indexes are computed and compared for a range of randomly generated portfolio exposures.
Motivation for Building an open source database based on EBA’s Standardized NPL Templates In an insightful recent piece, “Overcoming non-performing loan market failures with transaction platforms”, Fell et al. dug deeply into the market failures that help perpetuate the Non-performing loan (NPL) problem. They highlight, in particular, information asymmetries and the attendant costs of valuing NPL portfolios as key obstacles. In the same wavelength, the European Banking Authority published standardized NPL data templates as a step towards reducing the obstacles that prevent the reduction of NPL’s.