Is Global Debt Truly Astronomical?
Is Global Debt Truly Astronomical?
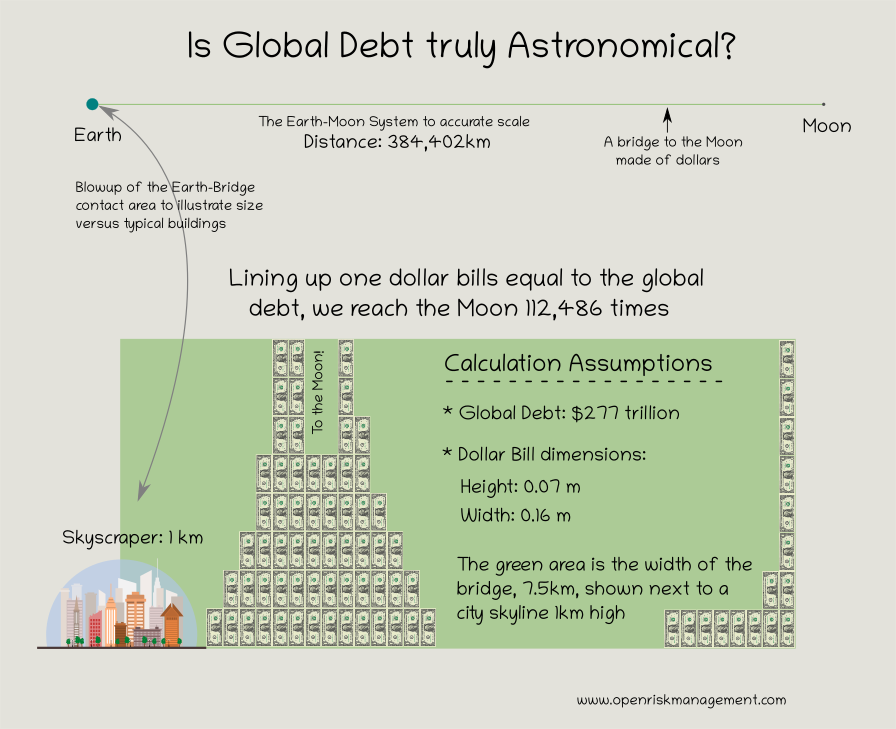
Is the size of global debt truly “astronomical”?

The notion of astronomical numbers and figures is quite frequently seeping in everyday language when large quantities of something are encountered in “normal” life. The strict definition of astronomical is obviously something of, or relating to, astronomy and astronomical observations but in common usage it also denotes something enormously or inconceivably large. This is, of course, because astronomical figures are inconceivably large!