Portable Standardized Graph Formats for Input-Output Databases
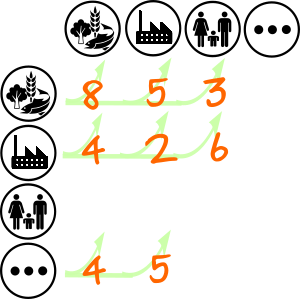
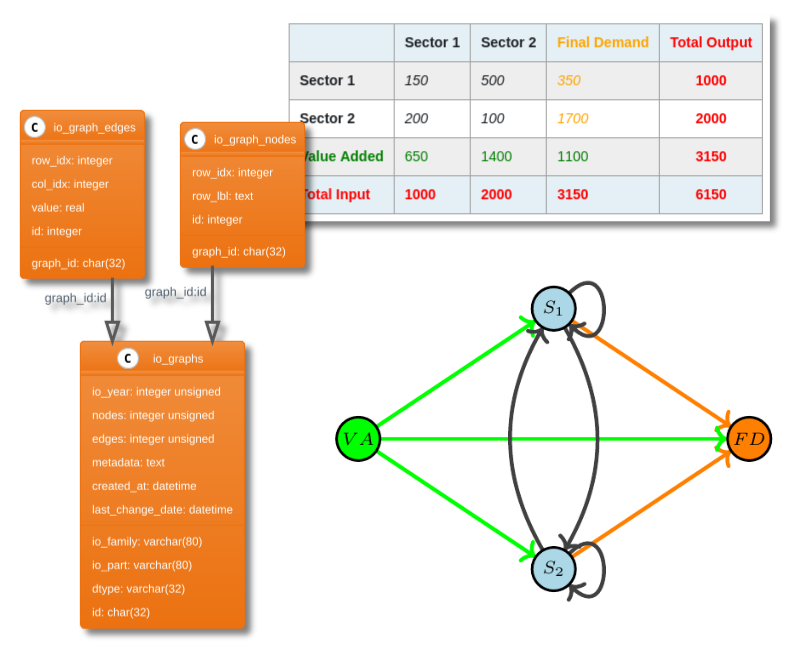
We discuss a simple, generic and portable format for disseminating Input-Output data. The format is inspired from the Graph representation of Input-Output matrices. It allows a flexible unified description which can be serialized into standard csv files and using a minimal sqlite database.
Accessing the wealth of statistical data in Input-Output databases
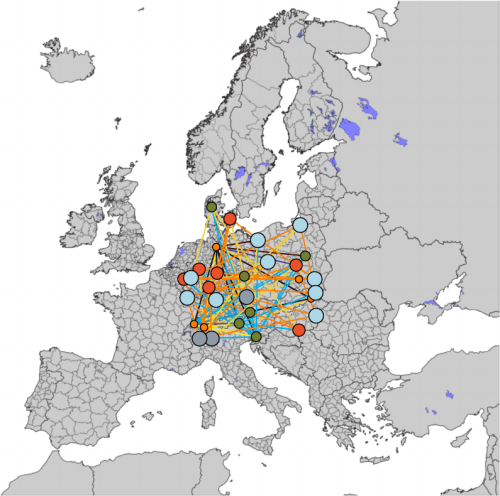
There are currently several important global initiatives that compile and make available statistical economic input-output data (IO). This is done typically on a multi-regional basis (covering many countries and regions, hence MRIO) reflecting the fact that international trade is (still) very much a reality. Environmentally extended input-output (EEIO) databases that are in turn based on economic activity IO data, are increasingly used to examine environmental footprints of economic activities and play an important role in the attribution and screening of regional and sectoral contributions to environmental stresses.