The big picture around data center environmental impacts
The environmental impact of ever larger and ever more data centers is currently a topic of heated discussion. In this post we take a step back and look into the overall landscape of environmental reporting of the digital economy footprints, sketching the big picture of what is being calculated, and reported and highlight some challenges associated with this task.
Concern about the environmental footprint of data center infrastructure is relatively new.1 In the early stages of the sustainability movement the volume of digital infrastructure deployed in data centers was dwarfed by the environmental impacts of other, much more mature industrial sectors (e.g., transport, manufacturing, agriculture etc.). Hence even as milestones such as the Paris Agreement (2015) accelerated worldwide efforts towards a sustainable economy, the Information and Communication Industry (ICT) sector received comparatively little attention.
An additional explanatory factor (besides relative novelty) for the belated interest in ICT environmental impacts is that, at least as far as GHG emissions are concerned, the ICT sector does not belong to the so-called hard to abate sectors. Utilizing electricity produced from renewable sources can significantly reduce environmental footprint (with caveats around the availability of grid capacity, storage technologies etc.). Finally, an other unusual aspect of the ICT domain is the expectation that digital services will exert benign influence on the environmental footprints of other sectors (via better data collection, automatisation etc.). Yet following rapid (one might say even explosive) growth in recent years, the study and disclosure of the environmental impact of digital services is acquiring more urgency. As a result, both the current and future impact of data centers (and digital services more generally) see now a growing body of research, analysis and reporting.2 3 4 5
In a recent IEA report5, the capital expenditure (CapEx) of just five digital-technology related6 companies is seen to be larger than the global investment in oil and natural gas production. The global electricity demand of data centers was in 2018 205 TWh, which represented about 1% of total global electricity demand but has reached 485 TWh in 2025, and is projected to reach 950 TWh in 2030, accounting for around 3% of global electricity demand. Electricity consumption from so-called “AI” data centres is projected to triple in the same period. Parallel to the rapidly growing energy consumption, e-waste is considered the fastest-growing waste stream in the world. The rapid technology refresh rate in data centers contributes this challenge. 53.6 million metric tons of e-waste were generated in 2019, only 17.4 percent of which was formally collected and recycled.7
Other environmental impacts such as water usage in water stressed areas are also coming into sharper focus. In the US, direct water usage in data centers more than doubled in the decade 2014-2024, and is expected to further multiply going forward.3 Indirect water usage, as required for the production of electricity used in data centers is not generally reported but could be significantly higher.8
In this post we take a step back and review key concepts used in establishing the environmental impact of data centers and some challenges associated with this task. We’ll start with discussing first some terminology. Perhaps as might be expected in a fast changing domain, definitions of various key terms are not particularly sharp. This can stunt the development of meaningful practices and over time erode trust.
The Data Center Terminology Mess
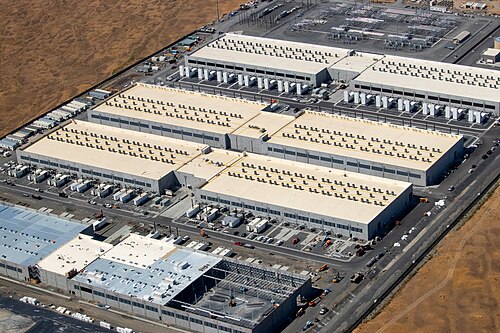
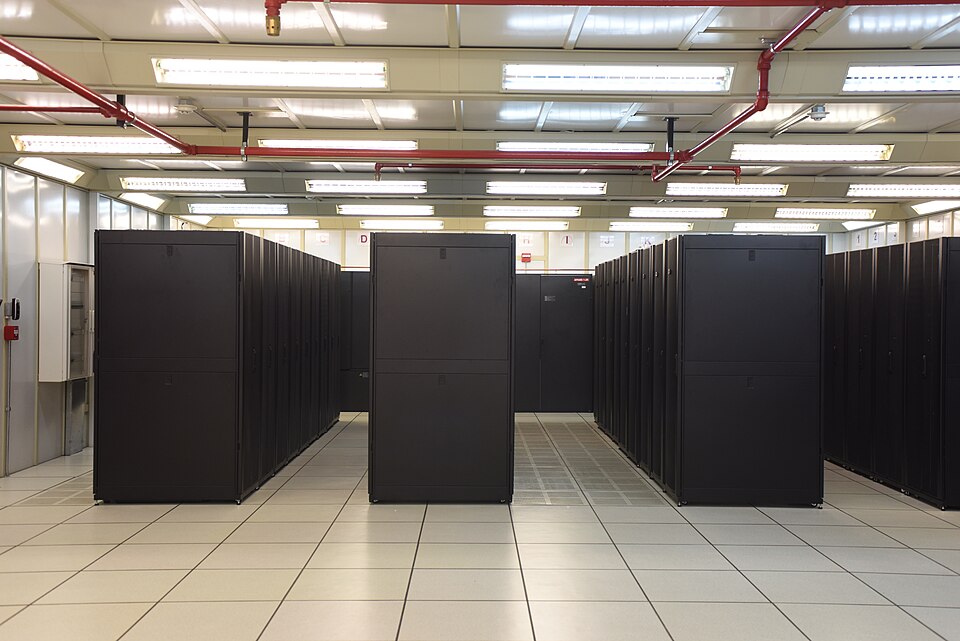
A solid departure point for the terminology discussion is the very definition of a Data Center . There is no formal such definition (which is indeed part of the problem), but loosely speaking a data center is an identifiable physical facility, typically one or more special-purpose buildings, but it can also be a designated space within a general purpose building. The facility must be used almost exclusively to house a variety of electronic equipment. Such equipment comprises computing servers that perform calculations, data storage systems that store information in digital form, and, importantly, communication networks that connect that data storage and computation, to the outside world. These components are collectively termed IT Resources. They are directly involved in enabling the digital services function, which is the reason the data center exists.
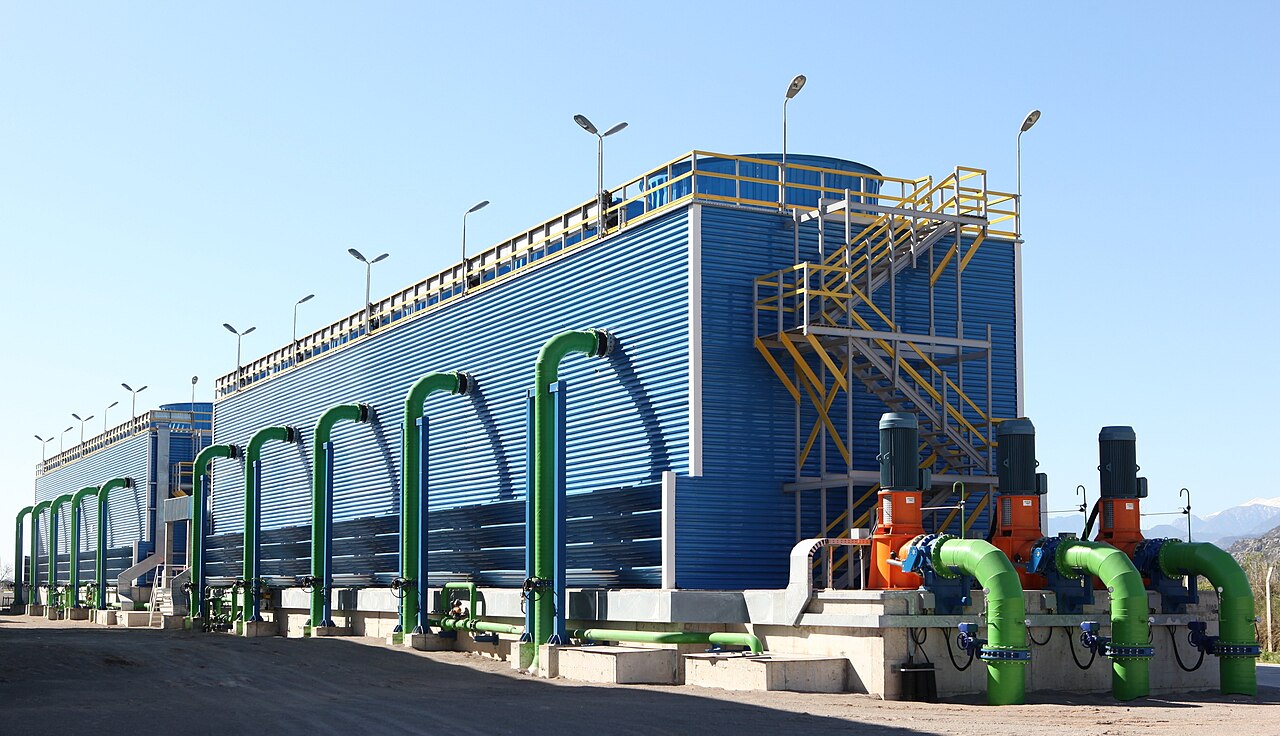
IT equipment cannot function without a range of critical supporting elements. Such components in data centers are: heating ventilation and air-conditioning (HVAC) equipment, uninterruptible power supplies (UPS), building lighting etc. These are collectively termed Non-IT Resources and they can account for significant electricity demand.9 A data center is thus a well-circumscribed, dedicated space that brings together these two classes (IT and non-IT) of elements. In addition it involves industrial-scale connections to utilities, most prominently for our purposes, for the provision of electricity and water services.
Despite what the name might suggest in a literal interpretation, data centers are much more than Data Storage Centers. The essential purpose of data centers is the provision of a variable menu of Digital Services , which is a very dynamic and fast changing set. Fundamentally it means using IT resources to provide digital information storage for starters, but most importantly to process and distribute information to outside users in almost continuous flow. Importantly, end-users of said digital services can be located elsewhere, in practice anywhere on the planet. There is no limit to how far end-users could be located, subject to an available network connection and accounting for network latency, the time it takes for information to travel back and forth over networks. Latency does indeed reduce the type of digital services that are viable for any given available network and desired services mix. Both network and computational capability elements are thus an essential part of the data center value proposition.
Data centers are evolving nowadays to be the main production units (factories) of the digital services available in a digitized economy. A more appropriate name for them might thus be digital service centers. But we should keep in mind that any digital service provided by a data center always has an end-user that requires additional, non-data center infrastructure to derive utility from these digital services. Thus there are additional IT elements involved, which may have a significant footprint.
Despite data centers having fairly uniform physical function and appearance, there is no formal definition and classification of their economic role. Terms such as hyperscale, cloud (public, private and hybrid), internal, on-premise, enterprise, edge, hosting or colocation data centers are used widely and variably without clear definitions. This reflects the multiple ways in which IT infrastructure can be embedded in the economy. Currently there is also confusion between a hyperscale data center versus a hyperscaler corporate entity. The result is that even the simple counting how many data centers operate in a certain area is presently an ill-defined task. The quote below from a World Bank report vividly captures this challenge.10
The above remarks suggest already that the proper accounting and attribution of environmental impacts from data center operations is not just a technical exercise in energy and water engineering. It must cope with diverse business models, regulatory obligations, substantial differences in technologies used, diversity of environmental impacts and strong dependence of these impacts on location. Minimally, alignment with established sustainability reporting frameworks for other business sectors would help for like-for-like evaluation and prioritisation. Thus, in this light, proper classification of data centers does become less of an academic exercise and rather a pre-requisite for meaningful attribution of environmental impacts from digital services.
Let us now review and try to streamline some of the above characterisations. The “right” classification depends on the usage one has in mind. For our purposes this would be the logical and transparent attribution of environmental impacts to the entities responsible. The starting point for this task would be the below diagram.
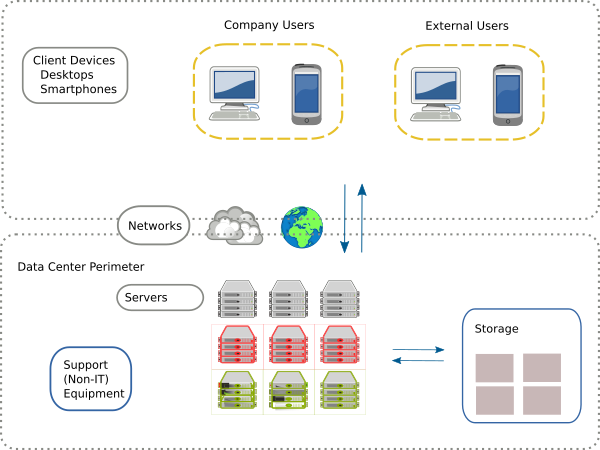
The business sector of the data center owners and, respectively, data center users, along with the type of digital services being provided defines the business model and how these relations are embedded in an economic network. Having a faithful such map would be the starting point of proper attribution. The challenges start creeping in given that the same physical pattern (a concentration of IT resources used by a range of end-users) can manifest in the economic realm in various ways:
- multiple corporate entities, potentially in different business sectors and providing different types of digital services can rent out data center space from the same data center owner. We will see this as the collocation pattern.
- there is commingling of diverse business models by large conglomerate entities.
- the definition of end-users can be ambiguous in an economic sense. The paying clients of data centers can be different from the majority of actual users of digital services, as it is the case, e.g., with social media.
Taking a step back from this modern-day complexity, it is maybe instructive to start the discussion of data center classification with the earliest such examples, the so-called high performance computing (HPC) centers, originating in a less complex era.
High Performance Computing Centers
HPC data centers (also Supercomputing Centers) are rather unique facilities, operated and used primarily by government entities. Internally these facilities always aim to use the latest, highest-end, computational and networking technologies, to tackle seriously demanding computational grand challenges.
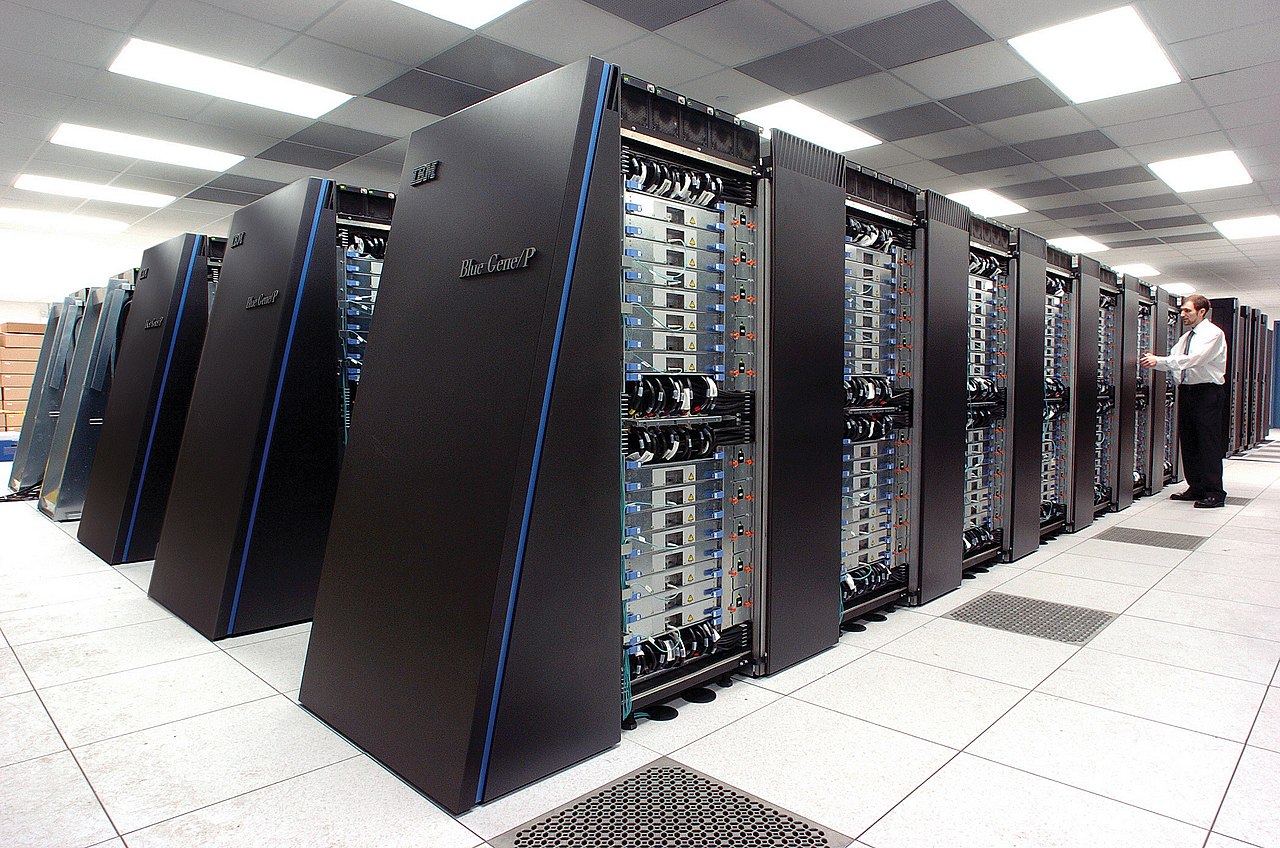
By-and-large HPC centers are owned and operated by the public sector (governments). Hence attribution of environmental impact to a legal entity is in this case straightforward. While there are only a relatively small number of public-sector run HPC centers per country, modern so-called accelerated data centers (“AI factories”) are similar to HPC in terms of their power intensity and may exceed them in size. Given HPC centers are operating under different incentives and disclosure regimes, they can in principle contribute important insights into advanced data center environmental impacts, see e.g.11. Yet at present none of the world’s Top 25 HPC computing systems (Top 500 list) reports their carbon footprint.12
Enterprise Data Centers in normal business sectors
For a long time private sector (commercial) data centers were mainly of the enterprise (also called internal data centers) type. Such internal data center types come in a wide range of sizes, from simple server closets or racks, hosting a number of servers, to server rooms and mid/high-end tier data centers, and now also “hyperscale” data centers. The objective of such facilities is to serve the business needs of a single corporate entity. These can be internal needs, for the sole use of company employees, e.g. in the manufacturing sector, but also in support of company clients and other external users, as would for example be in the banking sector. To the extend that traditional business models undergo so-called digital transformation, corporate entities increasingly need to own and operate enterprise data centers.
In practice, data centers belonging and operated by a corporate entity in almost any sector would be classified as enterprise data centers. An important exception, which we discuss separately below under Cloud Data Centers, is the provision of generic digital services as a business model. If we take the revised NACE 2.1 Classification as an illustrative guide of how entities are classified economically, this would be Group 63.1, two level deep within the overall ICT sector Section K. Explicitly:
- NACE 2.1 Section K Telecommunication, Computer Programming, Consulting, Computing Infrastructure And Other Information Service Activities
- NACE 2.1 Division 63 Computing Infrastructure, Data Processing, Hosting And Other Information Service Activities
- NACE 2.1 Group 63.1 Computing Infrastructure, Data Processing, Hosting And Related Activities
The size and intensity of enterprise data center operations reflects the volume and nature of the organization’s own size and business model needs. The IT equipment processes corporate owned data, and runs company owned applications, but as noted, external users may interact with those as part of obtained the principal good or service offered by this sector.
Colocation Data Centers
A colocation data center is a facility owned and operated by a real estate company that rents out the physical data center space to third parties (e.g. corporations) for them to place their servers and other network equipment. These third parties owning IT equipment within such a data center are said to be colocated within the data center. This is useful to organizations that may not have the resources needed to maintain their own enterprise data center, or simply find it more cost-efficient or otherwise advantageous to do externally. Notably, the non-IT equipment at the colocation center might be shared by all its tenants.
In the US many colocation centers are structured as Data Center REITs (Real Estate Investment Trusts) that are specialized public companies that own, operate, and manage facilities designed to house critical IT infrastructure. In principle any private or public corporate entity may provide a similar service.
In practice companies operating both in the ICT and the non-ICT sectors may utilize colocation data centers and many of even the largest technology companies do so.
Edge Data Centers
An Edge Data Center 13 is an emerging class of smaller sized data centers that are located closer to end-users, with the primary motivation to address network latency requirements. While the most energy intensive applications (the training of large LLM models etc.) are currently developed in large centralized data centers, these alternative designs may become more important in the future with the development of more localized patterns of utilization. NB: The smaller size of such centers is correspondingly matched by their larger numbers, thus their footprint need not necessarily be smaller.
Cloud Data Centers
Cloud Data Centers are data centers owned by specialized (ICT sector) entities that provide scalable (flexible as to the size and/or type and intensity) digital services to others. Here the business model is focused on providing a range of generic digital services to external customers. What counts of generic is of course a gray area. There are large numbers of cloud services clients: individuals, corporates or the public sector. Cloud companies offer access to storage, databases, algorithms, and other computational services.
Indicatively the NACE classification referenced above suggests the following services as characteristic of cloud data centers:
- provision of computing infrastructure, including cloud infrastructure and platform provision (IaaS, PaaS)
- cloud computing (except software publishing and computer systems design), whether or not in combination with infrastructure provision
- provision of technical infrastructure related to streaming services, data processing services and related activities:
- complete processing of data supplied by clients
- generation of specialised reports from data supplied by clients
- blockchain / distributed ledger technology (DLT) data processing activities
- specialised hosting activities, e.g.:
- web hosting
- application hosting
- general time-share provision of mainframe facilities to clients
- digitalisation of files (for further processing of data)
- provision of data entry services
- data centre colocation activities (i.e. rental of server and networking space in data centres, including routine monitoring of servers)
- digital data storage
- issuing of crypto-assets without a corresponding liability (not by a monetary authority)
NB: Notice the inclusion of colocation into cloud which is rather circular, it is typically cloud services that use colocation. Unlike the collocation data centers discussed above, the clients of cloud data centers are not tenants. The energy consumption related emissions of cloud data centers are fully attributed to the cloud providers Scope 1 and 2 and the clients Scope 3.10 Being focused on the provision of generic digital services, such data center operators aggregate very large numbers of servers. This gives rise to the term “hyperscale”. The power intensity of such data centers is also variable: if clients require accelerated computing cloud data centers will provide it, thereby multiplying the power intensity.
We have laid out now the basic characteristics of the data center categories commonly used in environmental impact reports. The classification dimensions that seem relevant from an environmental accounting perspective are the following:
- The Legal Ownership: The nature of the legal entity that controls the data center (one or more corporate entities, the public sector etc.). This will be the entity reporting environmental impact from owned data centers under Scope 1 and Scope 2.
- The Business Model: The purpose of the facility, the type of equipment, nature of digital services provided (and to whom). This determines the Scope 3 reporting, both upstream (embodied in IT equipment) and downstream (generated by Client Use)
- The Physical Size: The extend of the facility, e.g., the number of servers, its surface area, its total energy and water use etc. The provision of digital services to end-users scales in line with those variables.
- The Power Intensity: The intensity or IT resource utilization, which in turns links to digital service provision rates. E.g. the number of operations per second, the volume of data send over the network per second, the heat that must be carried away per area or volume etc. These rates will in general depend on the technologies used and the nature of digital service provided.
We can organize them as follows, indicating in each column the most typical situation, keeping in mind there are counter-examples in almost all cases.
| Category | IT Owner | Facility Owner | Downstream Users | Intensity | Size |
|---|---|---|---|---|---|
| HPC | Public Sector | Public Sector | Public Sector | Highest | Large |
| Enterprise (non-ICT) | Company (non-ICT) | Company | Company | Normal | Medium - Large |
| Colocation | Multiple Entities | Real Estate Company | Diverse | Normal - High | Medium - Large |
| Edge | Diverse | Diverse | Diverse | Low - Normal | Small |
| Cloud (ICT) | Company (ICT) | Company | Diverse | Normal - High | Very Large |
In reality there are further complications to the above scheme. E.g. large corporate entities may own their own enterprise data center portfolio, may operate cloud data centers, and make use of colocation facilities as well! The mixing of a variety of ownership and business models, along with diverse facility types by data center owners or operators means that environmental attribution of the overall impact of digital services can be highly problematic, obscured by complex and poorly disclosed relationships.
The above classification dimensions are by no means covering all facets that usefully characterise data centers. E.g., a standard classification of data centers is linked to the degree of redundancy and other protections offered by the data center. This can be quantified as the target uptime, the fraction of time during a period a data center operates without any hindrance. Tier 1 data centers offer 99.671% whereas Tier 4 ensure 99.995%. We omit this dimension as it does not have readily inferable implications for environmental footprint. Implicitly the diversity of arrangements for providing e.g., redundancy will be captured by the power intensity or space type of the data center.
The Hyperscaler Pattern
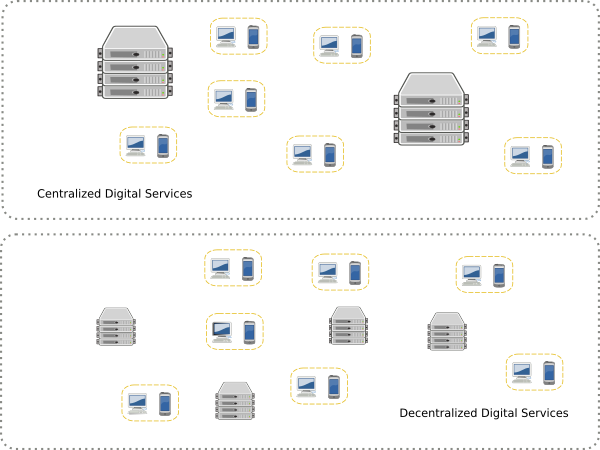
The current discourse about data center impacts is dominated by the development of very large data centers, operated by so-called hyperscalers. Understanding the impact of these gargantuan facilities is obviously important, not just quantitatively but also qualitatively, in terms of the trends, opportunities and risks they reveal. The context is that, historically, the concentration of computational resources has been oscillating between more or less centralized. Initial room-sized computers and so-called mainframes gave way to an era with capable personal computers and workstations, alongside with the maturing of the Enterprise Data Center . In the current juncture, end-user devices have been dominated by thinner designs (mobile phones) and hyperscale providers. But there may yet be another era of more powerful personal or local computing.
Ultimately what matters for an informed assessment of the footprint of digital services is having a holistic handle on digital services total supply and demand, and how this will be served by IT equipment that resides both inside and outside of the concentration points we call data centers.
As we saw with the example of edge facilities, aggregation of digital services in ever larger data centers is not the only means to organize a digital economy. High concentration of IT resources in central nodes contrasts with decentralized distribution of IT resources, where the production and consumption of digital services is spread more evenly.
Understanding comprehensively how environmental impact varies with alternative topologies is not only a prerequisite for completeness in reporting. It can also guide better decisions by considering the entire system, the incentives of the different actors, properly attributing the externalities generated, and preventing the possibilities of “leakage” (impacts hiding elsewhere in the economy). This last pathology is an important discussion relevant also in digital services context14.
Practically, while currently the focus and data collection and disclosure leans on the Scope 1 and Scope 2 impacts of large data centers, taking into account the full structure of digital service provision will be ultimately required.
The Secrecy about Environmental Impacts
Data centers are significant and costly industrial facilities. They have been studied extensively in terms of their energy and cooling needs, initially purely for economic reasons, to minimize costly energy consumption. Like any significant economic activity that involves equipment, data center operations leave a variety of both direct and indirect imprints on the environment. The list of noteworthy data center environmental impacts is not a-priory fixed. It is determined by the concrete technologies used to provide digital services (both the manufacturing and operational phase), and may change as those evolve.
An indicative list of impacts that have been considered in this context is provided by the ITU Life-Cycle methodology for ICT goods and services9. The list includes impacts such as:
- CO2 induced climate change (from all GHG inducing gases, direct and indirect)
- Ozone depletion (from CFC gases)
- Human toxicity (from e-waste and chemical affluent)
- Depletion of water resources (from direct and indirect water intake)
- Land use changes
- Other ecosystem impacts (noise, eutrophication, acidification etc.)
For each one of these, lifecycle analysis is the detailed bottom-up approach that conceptually provides a comprehensive inventory of direct and indirect environmental impacts. In most current studies concerning data centers the focus is on what are been considered the most consequential impacts, namely carbon and water footprints. Of the two, while GHG emissions is the environmental impact currently most discussed, see 1 for an early discussion of the electricity usage and GHG emissions, Water Use is coming increasingly in focus.8
The transparency challenge is that individual data centers don’t automatically report environmental impacts (though it is not technically inconceivable that they would!). It is corporate entities who collect low level data and, optionally, report certain summaries. This brings in the complexity of commercial and regulatory systems, which determines who reports relevant metrics, and how transparent and fit-for-purpose those might be.
Foremost is the issue of data availability, which hinges on the ability and willingness of data center operators to disclose relevant data points15. In any case, it is a fact that current reporting does not correspond 1:1 to any discrete data center facility. Reported enterprise (and hyperscale) data centers impacts are just one part of the overall inventory of an entity. Corporate reports will not in general split out individual data center impacts. Co-location centers may have multiple tenants renting fractions of the data center to diverse clientele. Reporting by the operator will in general not attribute impact to clients.
In principle both direct and indirect impacts are relevant. Direct impacts are associated with the operation of the data center (under the control of the owner of IT/non-IT equipment). Indirect impacts are associated with the construction of data centers, the impact from the production of energy used by the data center but which has been produced elsewhere, and the impacts from the downstream chain leading to the end-users of digital services.
Green House Gas Protocol
The most developed means to organize these different types of direct and indirect impacts are provided by the GHG Protocol recommendations. This is a set of detailed principles and methodologies developed by the World Resources Institute (WRI) and other institutions. It forms the basis of much current GHG emissions accounting across the world, in diverse contexts and business sectors. The Protocol comprises a number of guidances that apply to general classes of circumstances (e.g., new commercial projects, regular corporate sustainability reporting, assessment of products impacts, impact of local government operations etc.).
At high level the applicable GHG Protocol guidance for data centers is the Product Life Cycle Accounting and Reporting Standard.16 More sector specific guidance comes in the ICT sector specific document 17, and in particular Chapter 4, which focuses on Data Centers. Climate change impacts are established by assessing energy use and data center location, which determines the characteristics of the electrical grid (energy mix), local climate etc. 2.
Direct and Indirect GHG Emissions and Water Usage
Following the philosophy of the GHG Protocol, from a perspective centered on the entity (or entities) owning/operating a data center, impacts can be segmented into Scopes. While the GHG Protocol focuses on climate change considerations it is useful to adopt the parallel taxonomy for water usage. Emissions in data centers are both direct (e.g., electricity produced by on-site generators (Scope 1), procured from the grid (Scope 2) and indirect, embodied emissions. Those include both the upstream Scope 3 production of the equipment and downstream Scope 3 from use. The embodied impacts from the manufacturing of IT equipment (Upstream Scope 3) are not negligible and are well investigated. Finally, there are also emissions from the use of digital services by end-users that are tightly tied to the data center. Those would be downstream Scope 3 impacts.
Similarly to emissions, water usage in data centers can be classified as both direct (e.g., used in the cooling of IT equipment (thus “Scope 1”), indirect from water used in the production of the energy used in the data center (thus “Scope 2”) and another type of indirect usage: embodied in the upstream (“Scope 3”) production of the equipment.
We can organize all the above as follows with indicative examples for an enterprise data center owned and operated by a corporate entity:
| Impact | Scope 1 | Scope 2 | Scope 3 Upstream | Scope 3 Downstream |
|---|---|---|---|---|
| Water Usage | Direct (Cooling) | Indirect (Grid Electricity) | Indirect (Embodied) | - |
| GHG Emissions | Direct (Onsite Energy) | Indirect (Grid Electricity) | Indirect (Embodied) | Networks, End Users |
The alignment of Scopes between Water Usage and GHG Emissions reflects that the reporting entity avails (in principle) of similar tools in mitigating impacts. In the case of Scope 2, this might involve the selection of sites, discussions with utilities, while for Scope 3, this might involve discussions with upstream equipment suppliers etc. The importance of reporting indirect water usage has been emphasized in.18
Inventory Boundaries and Granularity
The GHG Protocol for the ICT sector works on the basis of a product lifecycle inventory 17 and stipulates that cloud and data center services create emissions in three main places:
- Data centers: switches, routers, and servers/storage devices used for receiving, sending, and storing data and the associated critical systems, facilities, and utilities
- Network: routers, switches, cables, and other equipment associated with the transfer of data between the data center and end-users
- End-user devices: PCs, laptops, tablets, phones, or other devices used to access data center services
Unless the networks and end-user devices are in a reporting entity’s control, their impacts would more appropriately be Scope 3 downstream impacts. The GHG Protocol outlines a number of options for calculating impacts for data centers, going into some detail into bottom up approaches but leaving top down approaches less specified. Taking into account actual practices, research and reports, the granularity could be to any of the following levels:
- Low Level, or Bottom Up, e.g., looking at individual servers, racks etc. As mentioned already, components are split into the IT and non-IT groups. IT components are further split into servers (of different types), data storage and networks. These estimates (counts and types of equipment) are the building blocks of the so-called bottom-up approach.
- Top Down or facility level, where each discrete data center facility is characterised by a variety of metrics: total rated power, surface area etc.
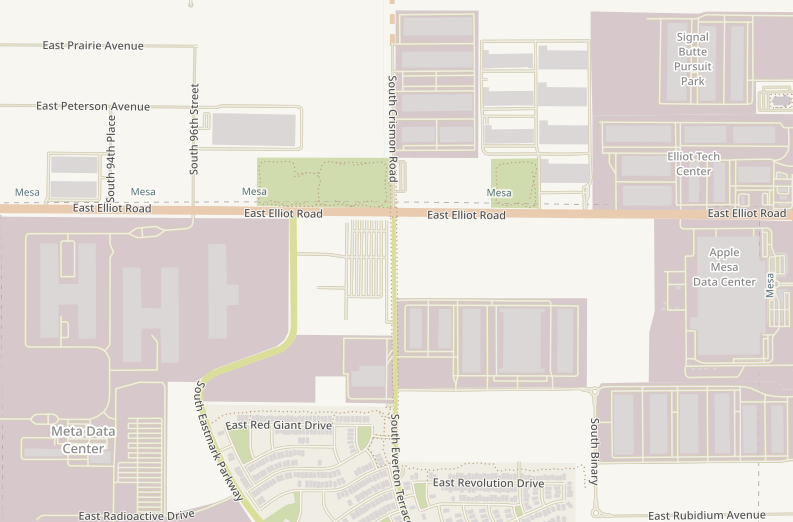
- Top Down, but at campus level, which reflects the fact that data center facilities belonging to the same entity tend to be clustered in nearby locations. Two or more nearby data centers will sharing the same local grid, water inputs and other facilities.
- Top Down, but at corporate level. This level aggregates the impact of the total data center portfolio of a corporate entity, but keeping it distinct from its other operations and their environmental impacts.
Corporate disclosures that do not isolate data center impact (and any associated digital services) according to some granularity are not following the principles of the GHG protocol’s ICT sector guidance and are of less utility.
Finally, there are other aggregation levels that are of potential utility but which do not follow the above corporate inventory hierarchy. This would be for example an Extended Campus aggregation, which considers data centers from multiple corporate entities. If multiple entities operate data centers in close geographic proximity such a extended campus report is relevant from an environmental perspective and it is not necessarily easy to produce from fragmented and non-uniform corporate reporting.
Ideally these different granularity levels are connected with theoretical accounting identities:
- The top-down facility level impact is the sum of all bottom up IT and non-IT component impacts.
- The corporate campus impact is the sum of individual buildings within said campus.
- The extended campus is the sum of all facility impacts in a defined area, irrespective of corporate ownership.
- The total corporate impact is the sum of all data center impacts, plus any additional corporate impact that is not data center related.
In practice, given very limited data availability, validating these identities is at present not realistic.
Beyond the GHG Protocol
Let us now discuss a complication that is emerging in the big picture, namely a qualitative difference between accounting for GHG emissions and accounting for Water consumption. First, let us state that energy consumption and water usage inside the data center are closely related. In fact, direct water usage is in a sense a facet of the same physical system and can be modeled as such.19. The departures from typical GHG accounting come because the specific location of a data center matters for water consumption in qualitatively different ways than it does for GHG emissions.
In GHG emission accounting, emissions are a globally fungible metric that can be analysed on a marginal basis independently of any other emissions. The location of a data center for GHG emissions is relevant to the extend that it determines, e.g., the local energy mix, which then informs the applicable emissions intensity. In contrast, the significance of water use impact is determined locally, in relation to the watershed, local water cycle and the natural ecosystem where the data center is operating. This means that, unless there is manifestly no meaningful water stress in a locality, the impact of an additional data center can only be assessed by taking into account all other existing data centers (and also any other competing local uses of water). Technically this is the distinction between an essentially linear methodology (the aggregation of GHG emissions) and a non-linear one (reflecting constrained water availability).
The impact of a large data center (which economically may provide digital services to a much wider geographic area), can thus be disproportionate to its host location. In 2 research reveals that in the US, one-fifth of data center direct water footprint comes from moderately to highly water stressed watersheds, while nearly half are fully or partially powered by power plants located within water stressed regions. In simple terms, the impact of 1 Liter of water of additional water drawn in a region must take into account this region’s conditions, whereas 1 kg of CO2 of additional emissions is evaluated in the context of the finite, but much larger (essentially planetary) carbon budget.
This is why in reporting water usage it is important to be able to compile a consistent and credible extended campus inventory, even while that involves multiple corporate entities, potentially with commingled business models etc. It is the cumulative impact of their combined direct and indirect water usage that is the most relevant metric.
The Uncertainty Calculus
The environmental impact of the digital services sector currently involves considerable uncertainty. Uncertainties, especially if undisclosed, can affect the usability and credibility of estimates in decision making. Therefore major efforts to produce objective and reliable error estimates around GHG emissions such as the IPCC methodologies20, and the GHG Protocol place a lot of emphasis on uncertainty estimation. The simplest methodology propagates uncertainties in the activity data, emission factors and other estimation parameters through the error propagation equation. If correlations exist, then additional terms are needed. At its most basic and simplified, environmental impact reporting frameworks decompose impact metrics as products of activity units times the impact per unit (intensity) as per the equation:
$$ \mbox{Impact} = \mbox{Intensity} \times \mbox{Activity} $$
which can be written more succinctly as
$$ I = f \times A $$
where $f$ is the intensity of impact and $A$ is the activity producing the impact. Uncertainty estimates can thus be schematically decomposed as the sum of two underlying uncertainties (ignoring their possible correlation).
$$ \Delta I = \sqrt{(\Delta f \times A)^2 + (f \times \Delta A)^2} $$
In the next step we must specify the nature of uncertainty we are want to quantify. There are two important subcategories:
- Data quality related uncertainties. This is what we might call accounting uncertainty. This uncertainty is introduced by the deficiencies in data collection and/or disclosure practices. While theoretically this uncertainty can be minimized with better data quality, in practice it may be very significant. Estimates of this type of uncertainty will typically accompany reports of the current impact from one or more data centers.
- Temporal or scenario uncertainties. These are intrinsic uncertainties about the trajectories of new and evolving markets and technologies. The data centers of the near future will vary in size, technical specifications, services provided, business models and thus the corresponding activity and impact footprints. Estimates of this uncertainty (while obviously subjective and model driven) provide a cone of uncertainty around best-estimate projections. In practice this function might be served with elaborating on different scenarios (and ideally assigning them grounded probabilities).
Uncertainty Drivers
A brief review of the above two main uncertainty drivers reveals a complex picture for both of them:
The intensity multiplier of data centers depends on complex interplays between the available underlying technologies and requirements from new use cases. In certain technology scenarios better energy efficiency is achieved through better, less energy demanding chip designs. Yet the utilization of higher power density chips (GPU’s or accelerators) for more intense computations works in the other direction, it is more energy demanding. While there are standard ways to estimate the power needs of any existing system, without distinction between “classic” and accelerated services there can be significant accounting uncertainty.
Another looming risk regarding accounting accuracy is the extend to which environmental impact indicators cease to be good measures, following the dynamic of Goodhart’s Law . One manifestation of this would be “leakage” of environmental impact elsewhere in the digital economy where it is less reported or regulated, or even a mutation of its very nature. For example building data centers in jurisdictions where environmental protections are less strict, or the development of more efficient energy or cooling technologies but which have side-effects, violating the Do No Significant Harm Principle .
The higher power-density of accelerated computing has knock on implications in how the equipment is cooled, driven by the growing power rating of the chips, as well as by the need to cluster more chips into a single rack for more efficient sharing of memory. NB: Multiple accelerator chips must be networked tightly together to function effectively as a single computer. This is necessary to estimate very large parameter algorithms on gigantic data sets. As an example, Nvidia’s Ampere architecture from 2020 had a rated power of 400 W per chip and clustered 32 chips per rack, resulting in a power density of around 13 kW per rack. The current Blackwell architecture has a rated power of 1000 W per chip and 72 chips per rack, with a power density of 130 kW per rack, an order of magnitude higher5. Architectural changes can also reduce energy intensity, for example the introduction of the ARM CPU architectures versus older x86 designs may (for the same computation) achieve up to a fivefold efficiency gain.
The activity multiplier (how much of each technology is used) is a more open ended and uncertain variable. It depends on the supply and demand of digital services, which is a complex economic, even cultural phenomenon. Dramatically larger amounts of digital services activity are fairly plausible to imagine.
This jump in required computational activity happened e.g., when the processing and distribution of digital audio and video content became as prevalent as the resource-wise much more frugal processing of digital text (email, messages etc.). A simple switch of media type can mean orders of magnitude different computational requirements.
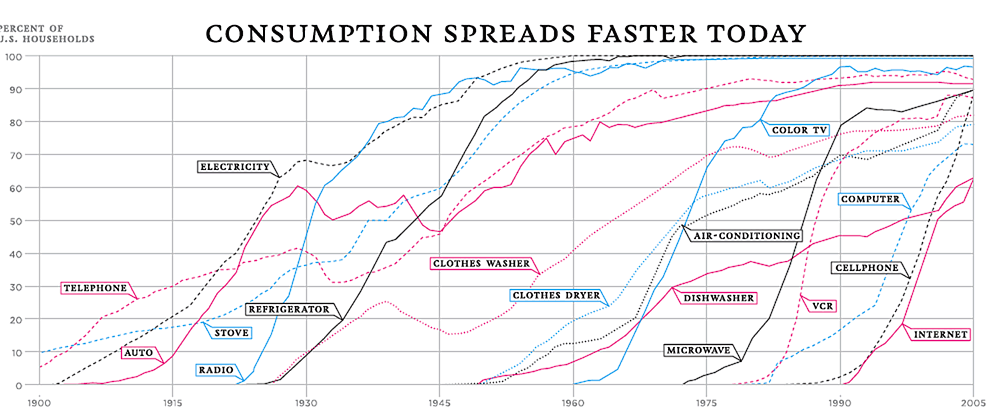
In an ever more digitally interconnected world new digital services can see extremely rapid adoption. Digital technologies have indeed exhibited some of the most accelerated adoption patters in modern industrial history. In addition, the lowering of overall costs for digital services (which is an established long running trend) may become another manifestation of the Jevons Paradox, generating further adoption, thus more environmental impact.5 We can conclude that the biggest uncertainty in future environmental impact is likely to be driven by changes in activity rather than changes in technology.
Summary
- Data Centers are evolving and growing to become material aspects of the economy.
- There is substantial confusion about terminology, which complicates forming clear and unambiguous overviews.
- There is lack of transparency about environmental impacts, in terms of the range of metrics being disclosed, their granularity and the consistency of reporting
- While GHG emissions reporting has well articulated methodologies (though choices are not lacking controversy), other stresses such as water, less so.
- There are significant uncertainties both around current footprints, and even more so about potential future scenarios
References
-
A. Shehabi et al. Data center design and location: Consequences for electricity use and greenhouse-gas emissions. Building and Environment, 46 (2011) ↩︎ ↩︎
-
Siddik, et al. The environmental footprint of data centers in the United States. Environ. Res. Lett. 16, 2021 ↩︎ ↩︎ ↩︎
-
Lawrence Berkeley National Laboratory, United States Data Center Energy Usage Report, 2024. ↩︎ ↩︎
-
IEA, Energy and AI, 2025 Report ↩︎
-
IEA, Key questions on Energy and AI, World Energy Outlook Special Report, 2026 ↩︎ ↩︎ ↩︎ ↩︎
-
A poorly defined category to intermingles many business sectors besides ICT. ↩︎
-
ITU and The World Bank. Green data centers: towards a sustainable digital transformation - A practitioner’s guide. 2023. ↩︎
-
Alex de Vries-Gao, The carbon and water footprints of data centers and what this could mean for artificial intelligence, Patterns 7, 2026 ↩︎ ↩︎
-
International Telecommunication Union, Methodology for environmental life cycle assessments of information and communication technology goods, networks and services, ITU-T L.1410 (2024) ↩︎ ↩︎
-
The World Bank and ITU. Measuring the Emissions & Energy Footprint of the ICT Sector: Implications for Climate Action. 2024. ↩︎ ↩︎
-
Y. Jiang et al. ThirstyFLOPS: Water Footprint Modeling and Analysis. Toward Sustainable HPC Systems. 2025 ACM/IEEE International Conference for High Performance Computing. 2025 ↩︎
-
V.Rao and AChien. Modeling the Carbon Footprint of HPC: The Top 500 and EasyC. In Workshops of the International Conference for High Performance Computing, Networking, Storage and Analysis (SC Workshops 2025). ↩︎
-
L.Xue et al. Towards Decentralized and Sustainable Foundation Model Training with the Edge, ACM SIGENERGY Energy Informatics Review, Volume 1 Issue 1, 2021 ↩︎
-
S. Bastianoni et al. The problem of assigning responsibility for greenhouse gas emissions, Ecological Economics 49 (2004) 253–257 ↩︎
-
E.Masanet et al. To better understand AI’s growing energy use, analysts need a data revolution, Joule 8, 2427–2448, 2024 ↩︎
-
World Resources Institute, Product Life Cycle Accounting and Reporting Standard, 2011 ↩︎
-
GHG Protocol, ICT Sector Guidance built on the GHG Protocol Product Life Cycle Accounting and Reporting Standard, 2017 ↩︎ ↩︎
-
Pengfei Li, Jianyi Yang, Mohammad A. Islam, and Shaolei Ren. Making AI Less ‘Thirsty’. Commun. ACM 68, 7 (2025) ↩︎
-
N.Lei and E.Masanet, Climate and technology specific PUE and WUE estimations for U.S. data centers using a hybrid statistical and thermodynamics-based approach. Resources, Conservation & Recycling 182 (2022) ↩︎
-
IPCC Guidelines for National Greenhouse Gas Inventories, Chapter 3, Uncertainties (2006) ↩︎