Using Equinox to Record Data Center Environmental Impact Data
In the third post of the Data Center series we search for publicly available data about the environmental impact of data centers and explore how to organize them inside the Equinox platform.
In the first post of a series dedicated to the measurement of data center environmental footprints we reviewed the conceptual thought frameworks and challenges inherent in this emerging domain, which is both technical and multi-disciplinary. In the second post we outlined the most prominent currently used measurement methodologies, and documented their quantitative prescriptions in concise mathematical form. The main objective in this third post is to start connecting these concepts with actual data, as these are being reported. In this quest we will adapt and use the Equinox platform. Equinox is an open source integrated web and database tool that supports holistic Sustainable Portfolio Management.
The Equinox platform integrates geospatial capabilities with applicable regulatory and industry standards from the GHG Protocol, EBA, PCAF, the Equator Principles and more, to provide a holistic view of the footprint of both individual projects and portfolios. In the current application we will explore how to capture (record) and work with data center environmental impacts by adapting the fundamental primitives and affordances of the platform. This post aims to offer a first impression.
Data Sources
The first order of business is to identify readily available sources of public data for environmental impacts of data centers. We mentioned already in previous posts that publicly available data about data center environmental impacts are deficient. The limited measurement of data center (and more broadly ICT) emissions and impacts is a result of historical priorities, data complexities, and comparably lower emissions. However, circumstances are changing due to rapid digitalization. Four ICT sector companies are now among the top 20 corporate consumers of electricity, the only ones outside the traditional high-emitting industries: chemicals, construction, metals and mining, oil and gas, and utilities (See 1 2).
Existing data sources can be broadly categorized as follows:
- Corporate disclosures (e.g., annual sustainability reports) by companies that own, operate and/or use data centers. These disclosures will typically follow an established protocol and there will be assurance by third parties.
- Reports by environmental, statistical, energy or development agencies. Those wil be based on a mix of commercial surveys and public data, and will in general be aggregate in nature, focusing on sectors and/or geographical regions.
- Research publications that investigate specific topics around data center environmental impacts (in cases where they also publish the data used).
Further data and information sources are available, from journalistic reporting to (local) government sources, but these might be less regular and structured.
Company Disclosures
The publication of select private data by companies is likely the most important source of granular data about data center operations and impacts. Entities operating in this sector collect in principle a wealth of data about both energy and water usage, as those are essential operational parameters for these facilities. Yet both the granularity and the range of metrics being disclosed may be insufficient for obtaining an informative picture around data center environmental impacts.
On the granularity front, data centers enter an entity’s environmental footprint inventory in various ways: as owned enterprise facilities, as leased colocation spaces, as the use or the provision of cloud digital services etc. A desirable level of data center reporting granularity would identify material footprints per each of the above categories.
Regarding the range of reported metrics, energy, GHG emissions and water usage per data center are the critical data points, along with important technology and region related multipliers such as power usage efficiency (PUE) and water usage efficiency (WUE).
IEA and ITU/World Bank Data
An important overall view of the aggregate development of data center energy and environmental footprints is provided by the International Energy Agency (IEA) reports. The IEA collects and publishes aggregated data for a variety of jurisdictions, split according to data center types.3 4 Similarly, the joint International Telecommunication Union and World Bank Report 2 includes aggregate data about select country case studies.
These reports integrate a number of insights that are not publicly available elsewhere, thus they provide important benchmarks. Yet due to the high aggregation, these reports are of limited applicability when it concerns individual operators, data center facilities and specific locations.
Research Publications
Research publications can be another source of relevant information. Without any claim of bibliographic completeness, the following is a list of publications that include various metrics at different levels of aggregation:
- 2026 Gao. (Based primarily on select company reports and further analysis) 5
- 2024 Masanet et al. (Aggregate Company Level)6
- 2024 Shehabi et al. Lawrence Berkeley National Laboratory Trends7
- 2021 Siddik et al. Low Level Data 8
An obvious limitation of research publications, besides the possibly limited scope of the research, is the absence of regular (annual) updates.
The IM3 Dataset
Specifically for US based data centers, the interesting IM3 dataset9 contains locations of existing facilities derived from OpenStreetMap (OSM), a crowd-sourced geographic database. The development of the IM3 database is a multi-institutional effort led by Pacific Northwest National Laboratory and supported by the U.S. Department of Energy’s Office of Science as part of research in MultiSector Dynamics, Earth and Environmental Systems Modeling Program.
Auxiliary Data
This very brief review of the data landscape would not be complete without mentioning
important additional sources of reference data, such as the EPA/eGRID that provide information about local electricity grid characteristics, water stress indices etc. These are data sources that help establish location specific impact factors, such as the degree to which local electricity grids are powered by renewable sources and their water utilization profile.
Equinox Data Models
With the above patchy and evolving data landscape as backdrop we now turn the discussion to suitable data models (within the Equinox platform) that can be used to record relevant data. The central piece of the puzzle, the key building block, is the representation (modeling) of individual data center facilities (each one assumed to have material environmental impact). This approach represents the highest level of desired spatial granularity. It is complemented by annual measurement snapshots as the highest level of temporal granularity.
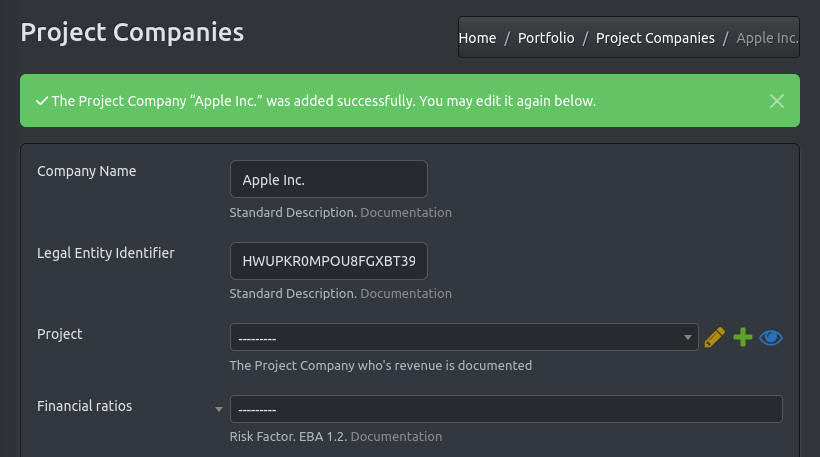
The Data Center Data Object
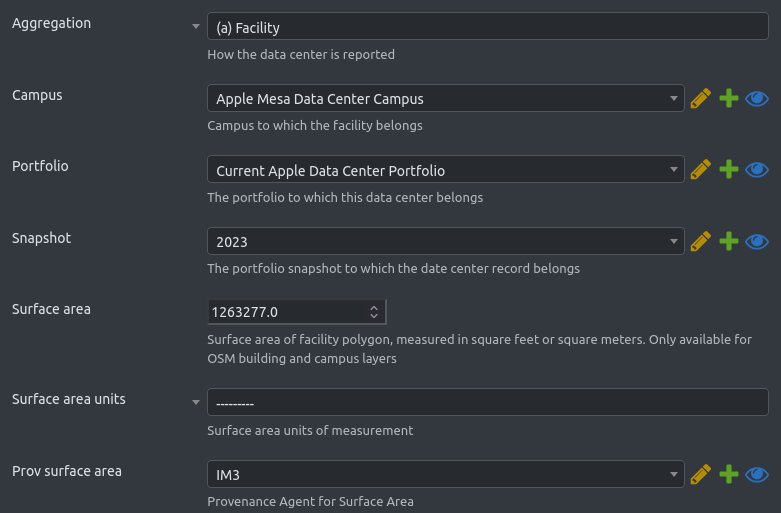
The lowest level representation models individual data center facilities as distinct buildings. Data centers are indeed a special type of commercial (industrial) real estate. They are digitally networked to provide digital services at scale to outside users. They are also linked to utilities that provide electricity and water input and outputs.
Implicitly the focus here is on data centers with materially large floor space, which draw significant amounts of power and house significant amounts of IT equipment. Setting an explicit threshold is not needed for our current purposes.
In terms of the nature of required data elements, a data center object is a composite of facets such as:
- generic building attributes (real estate)
- IT related attributes (energy consuming equipment)
- financial asset attributes (legal entity, business model)
- environmental impact attributes (emissions, water usage)
An indicative list of attributes gives a flavor of the nature information that must be captured:
- Owner / Operator (reporting entity)
- Business model (enterprise, colocation, cloud etc.)
- Data center location and region
- Data center size (in square meters or feet)
- Nominal electric capacity (e.g., 10 MW)
- Numbers and types of servers, routers, and storage devices
- Power Usage Efficiency
- Water Usage Efficiency
- Local energy energy generation (amount and source type)
- Grid electricity used
- Carbon and Water intensity of grid electricity
- Commissioning date (start of records)
- Average and peak power utilization
- Age of IT equipment
The above is a mix of numerical data, and standard text and categorical data. In terms of temporal variability, there will be both static (non-changing or slowly changing fields) and annually changing fields (in particular environmental impact measurements). Temporal variability might be both due to higher demand / utilization and changing technical specifications. Introducing additional attributes per data center as necessary is an easy task within Equinox.
Geospatial Data
Special mention is warranted for the recording of geospatial data. The location of a data center is an important factor that determines or influences multiple outcomes. In addition, the building footprint is itself an indicator of data center capacity. At present the data model stores (where available) the so-called barycenter of a facility which is a Point geometry.
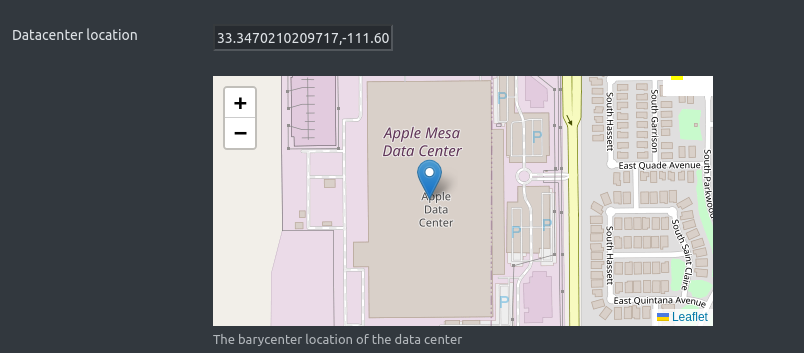
More complex geometries (the building perimeter) will be introduced in future Equinox versions.
Importing IM3 Geospatial Data
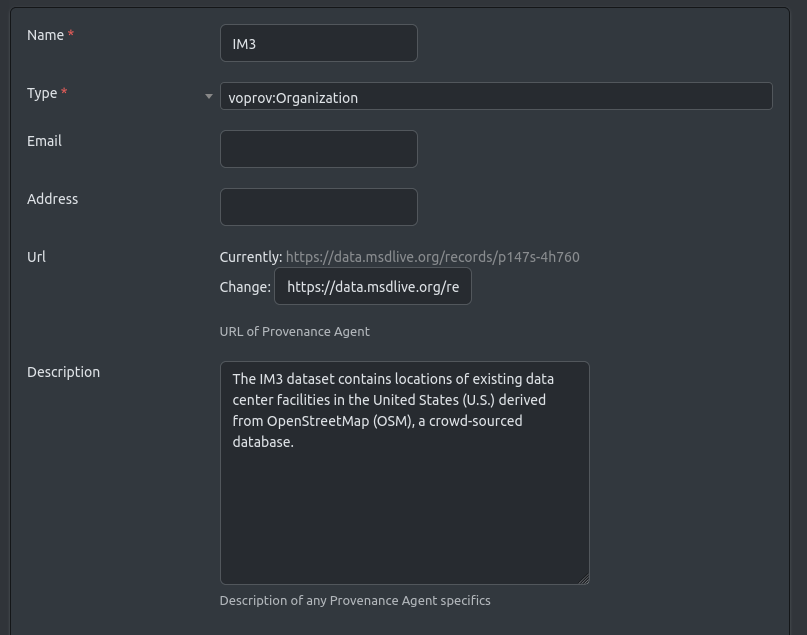
IM39 is a multi-institutional effort led by Pacific Northwest National Laboratory (PNNL) and supported by the U.S. Department of Energy’s Office of Science as part of research in MultiSector Dynamics, Earth and Environmental Systems Modeling Program. The dataset contains locations of existing data center facilities in the United States (U.S.) derived from OpenStreetMap (OSM), a crowd-sourced database.
Data points from OSM are processed in various ways to determine additional variables provided in the data, including: facility area (in square feet) and the associated U.S. counties and states.
NB: Data center locations were derived from OpenStreetMap, which is made available at openstreetmap.org under the Open Database License (ODbL).
As an example, running a script we can load all Apple specific data center information that is available in the IM3 dataset:
python manage.py load_dc_apple_im3
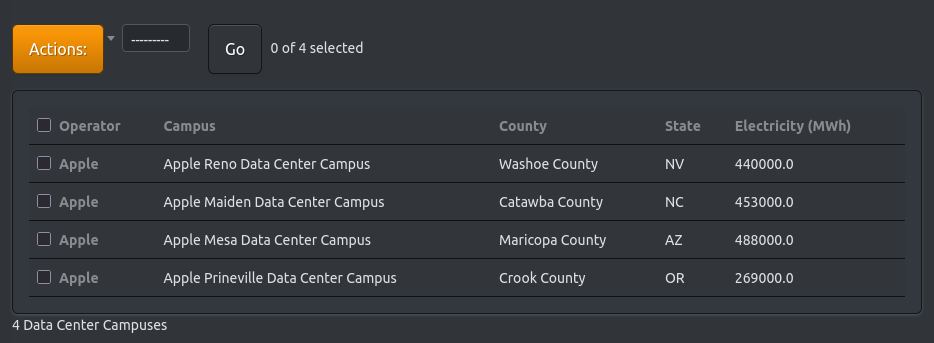
When we inspect the collection of Data Center facilities obtained this way we find seven entries.
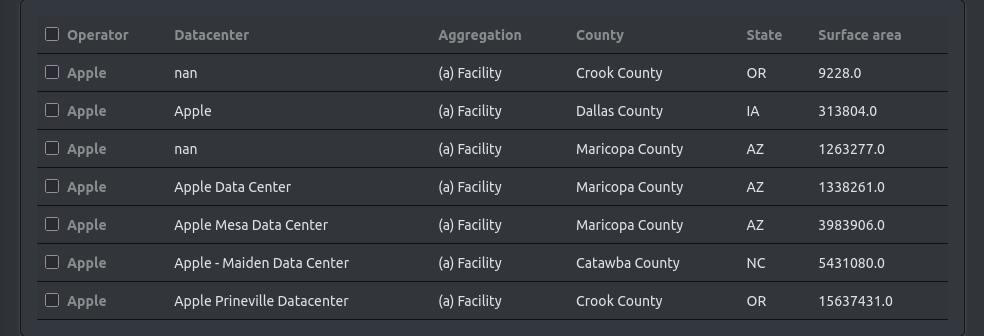
We can salvage a few more data points by identifying entries with missing names. Finally we get a total of 19 entries.
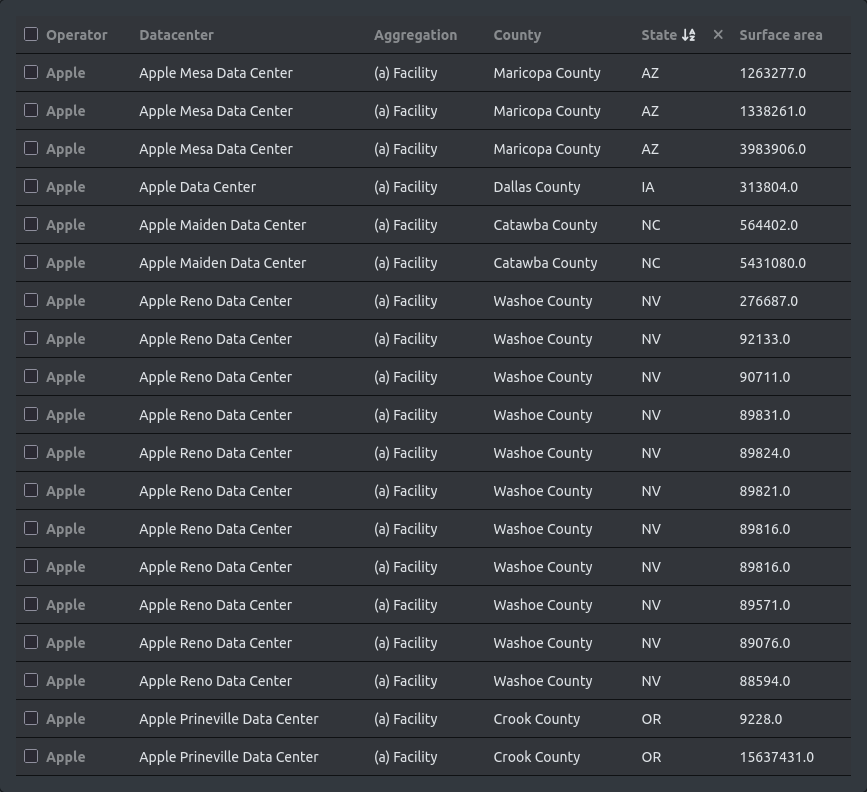
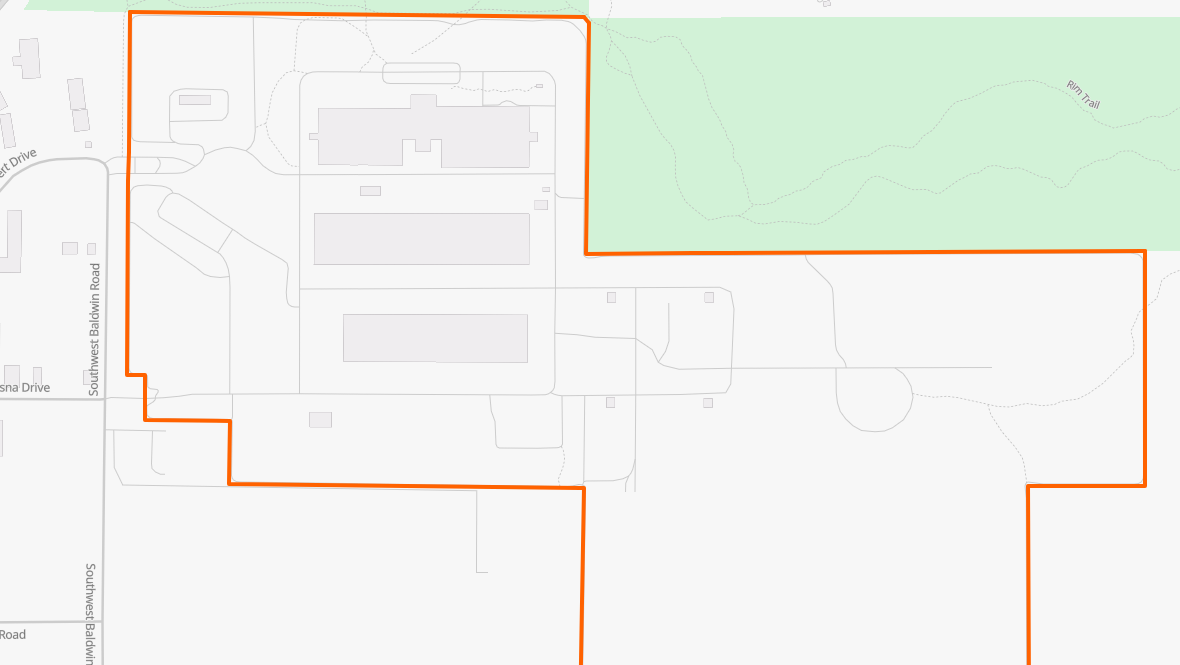
When we inspect the geographic location of these facilities using an appropriate map view (see below), we notice that these facilities are actually concentrated in a few locations, which brings us to the next important data model we introduce, namely that of a Data Center Campus.
The Data Center Campus Object
A single standalone data center building as per the previous data model does not in general match how these facilities are currently organized operationally and, importantly, how their impact is reported. An important pattern seen in practice is the data center campus. A campus is a collection of nearby data center buildings, in the same industrial terrain, all belonging to the same entity.
Such extended facilities, hosting multiple buildings, reflect the gradual expansion of capacity within a dedicated area. They provide optionality and flexibility towards expanding capacity in line with demand. The fact that the campus already provides common services means that further expansion benefits from economies of scale.
An important point: if companies provide at all data center impact metrics in their sustainability reports, these are at campus level, not at individual data center level.
This difference in data granularity means that an important and widely used metric of data center capacity, namely floor space must be treated as a composite: it is the aggregation of the surface areas of all individual building belonging to the campus.
Yet caution is required when using geospatial map data for the purpose of assessing data center size: it is the area of the actual data center buildings that is relevant for this metric, not the entirety of the company owned campus!
According to company 2024 reports (2023 period), in our working example there are four distinct data center campuses in the US. We create an entry for each one of them. This provides us with four documented campuses where we can insert the reported electricity consumption from company reports. Two additional US data centers can be recorded as historical and future facilities respectively.
The Operator / Corporate Owner Object
Next we focus on data center ownership and business model attributes. In GHG protocol terms the focus of current corporate reporting is on Scope 1 and Scope 2 emissions from data centers.
In our working example the data centers (within campuses) are all owned and operated by one entity but this is not the only applicable pattern: colocation centers allow a diverse set of tenants to share a data center, operating their own IT equipment. In this case the majority of impacts are attributable to the tenant/operators and are Scope 3 emissions of the data center corporate owner.
Without additional share attribution data such colocation data centers cannot be modeled
As a partial remedy, if a company does report operational details of colocation center use (as Apple does on aggregate basis), these can be captured in a less detailed data object that models “colocation”.
Equinox Portfolio Views
While we positioned the data center and campus data models as the key pieces of the puzzle, we move now to discuss the bigger picture (the scope) within which these pieces fit together. There is of course not a unique scope. Much depends on the objectives of the study or reporting we intent to do. The same pieces could become part of a regional or country level report, focus on particular groups of ICT entities etc.
To implement the desired container structure, the first step is to create a suitable portfolio structure. The portfolio of individual data centers and/or campuses will link all the pieces of information that we will collect.
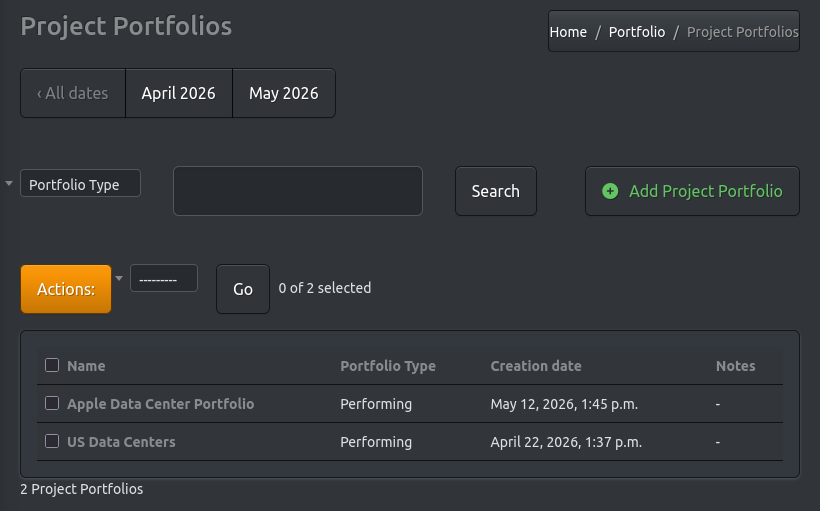
Building on the working example we create a new portfolio enty:
- Portfolio Name: The Apple Data Center Portfolio.
- Portfolio Type: This is “Performing” data center portfolio, involves only existing data centers in operation, no future developments or discontinued facilities.
Especially during the current period that sees intense investment activity in data centers the actual currently operating performing (operating) portfolio might be projected to be augmented by larger future portfolios. Capturing those separately with projection on environmental impact enables the performance of “what-if” analysis.
On the other hand, as new installations, technological changes or other reason deprecate certain facilities, those can become part of the historical portfolio, which is again useful to maintain for a variety of historical analyses.
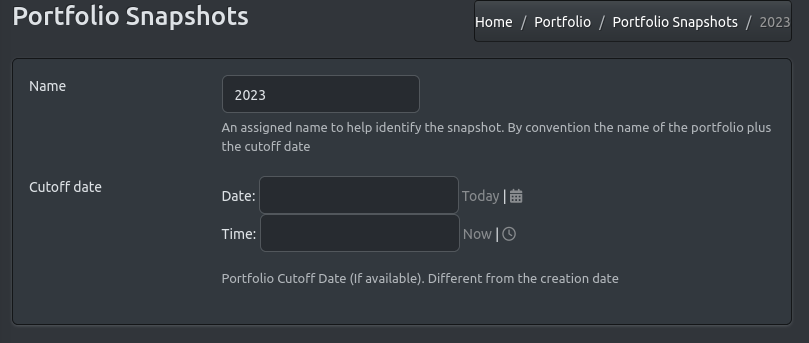
The time period for which we will collect information for the given portfolio is another important dimension. All measurement data for data centers included in the snapshot will refer to that period. The same portfolio may have multiple snapshots, capturing the evolution of the sector.
As an example, we create a portfolio snapshot with name “2023” that will hold data from 2024 reports. We can add further snapshots later if we want to expand the data set.
Adding Company and Operator models
The Company data model is of obvious utility as these are the entities reporting on environmental impacts. Associating data centers with company entries enables the corresponding filtering and aggregation of data.
The Operator model is variation of the Company model that identifies the operator of the data center. For a colocation data center this will be different from the companies that use it.
Provenance Information
As we insert data into the Equinox data base we want to document the source of the data. The Provenance part of the application provides a set of ready made data models that can be used for this purpose. The one we will use here is the PROV agent record, which, as the name implies, captures the source of a particular piece of data.
Finally we can get an overview of all campuses overlaid on a map.
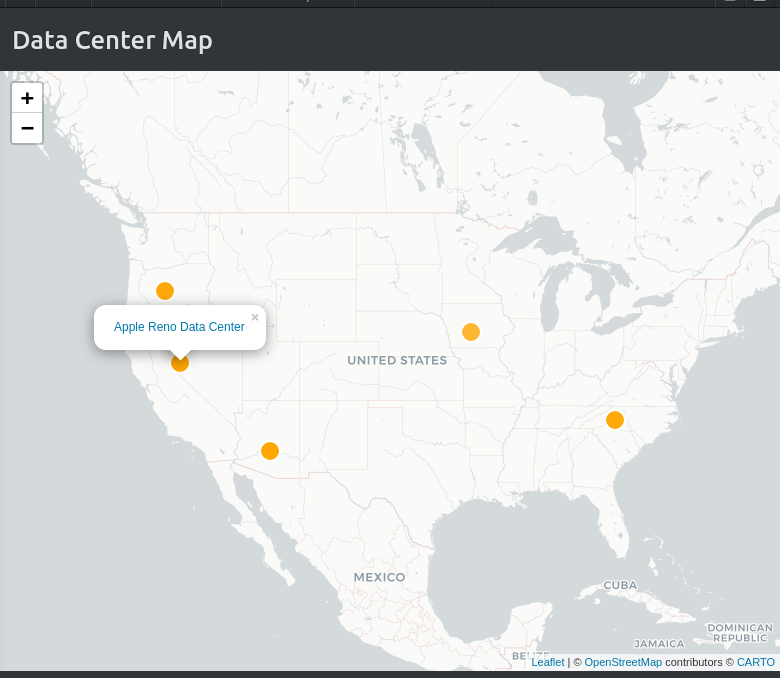
In a live instance of Equinox these maps are interactive, allowing zooming and examining data points in more granular detail.
Data Quality Standards
In the last section of this post we make a first foray into data quality standards. Given the challenging data landscape we already mentioned, this is both of obvious importance, but it is maybe worth expanding on what “good would look like”. Formal data quality frameworks aim to establish Data Quality Standards by setting concrete objectives. Such objectives can be made more concrete and manageable when defined with reference to certain data quality dimensions.
Our main data sources are on the one hand corporate disclosures from various parties, while on the other various aggregate reports and auxiliary data following diverse methodologies. Hence data quality standards in this context refers to the overall quality that can be achieved when combining such sources. A comprehensive data quality assessment is rather difficult, but a brief review helps structure attention points, as we further develop the methodology of collecting and processing the available public data.
- Data Availability, whether data are available to relevant stakeholders. The main channel is the publication of (voluntary) corporate sustainability reports.
- Data Suitability, whether the data are fit for purpose. This is a controversial topic. There is for example a dichotomy between so-called location based and market-based reporting. The later reports reduced impact by factoring investments into renewable energy projects. Those investments may or may not be correlated with the actual data center footprint.
- Data Completeness, meaning whether measurement values are present where required. As mentioned, this is hardly the case. There are substantial gaps, certainly in terms of granularity and disclosed metrics but also the absence of Scope 3 disclosures.
- Data Validity, whether data are founded on an adequate and rigorous classification system. Reporting for GHG emissions is generally based on GHG Protocol methodologies. Water usage reporting is less standardized.
- Data Consistency, whether a given set of data can be matched across different data sources. This is currently a major challenge. NB: Even the definition of a data center might diverge between different reports.
- Data Accuracy, whether data are substantively error-free. For corporate disclosures assurance is provided by third parties.
- Data Provenance, namely being able to trace the history and processing of data. This is something that can only be ensured at the most basic level (linking to reports). Further provenance is typically not provided.
- Data Timeliness, whether data values are up to date and provided regularly. This will in general be the case for corporate disclosures, but sectoral studies are not regularly published.
- Data Uniqueness, whether aggregate data are free from duplication. This may affect in particular aggregated reports.
Different applications and use cases put different weights on these dimensions. For our purposes these considerations motivate the development of particular platform features that make, to the degree possible the data quality issues more transparent.
Summary
- There is a range of possible data sources of relevance (corporate disclosures, agency surveys, academic research etc.)
- Geospatial data are an important and non-trivial component of the input data set.
- Organizing the publicly available data to document data center environmental impacts requires specialized software tools.
- The Equinox platform helps integrate geospatial information (data center location and/or perimeter) with structured information such as reported metrics.
- Adopting a Sustainable Portfolio Management perspective helps embed available data points in a coherent set.
References
-
E.Masanet et al, To better understand AI’s growing energy use, analysts need a data revolution, Joule 8, 2427–2448, 2024 ↩︎
-
The World Bank and ITU. Measuring the Emissions & Energy Footprint of the ICT Sector: Implications for Climate Action. 2024. ↩︎ ↩︎
-
IEA, Energy and AI, 2025 Report ↩︎
-
IEA, Key questions on Energy and AI, World Energy Outlook Special Report, 2026 ↩︎
-
Alex de Vries-Gao, The carbon and water footprints of data centers and what this could mean for artificial intelligence, Patterns 7, 2026 ↩︎
-
E.Masanet et al. To better understand AI’s growing energy use, analysts need a data revolution, Joule 8, 2427–2448, 2024 ↩︎
-
A.Shehabi et al. Lawrence Berkeley National Laboratory, United States Data Center Energy Usage Report, 2024 ↩︎
-
Siddik, et al. (2021). The environmental footprint of data centers in the United States. Environ. Res. Lett. 16 ↩︎