Developing a crowdsourced database of European Data Centers - assessing data quality
In this post we explore data quality challenges towards compiling a database of European Data Centers. The core dataset we use for this purpose is sourced from OpenStreetMap (OSM). OSM provides an inventory of geospatial features and other information that can serve as the basis towards a detailed data base of data center environmental impacts. We investigate what are some immediate data quality issues that we face in this task and possible ways to overcome them.
The euroDace project is a new geospatial database of European data centers that we launched recently. In this post we explore a first set of data quality challenges towards developing a more comprehensive and robust data center information database, with an eye towards inferring environmental impact footprints.
Background information and motivation for the euroDace project was provided in three earlier posts:
- In the first post we reviewed the conceptual thought frameworks and challenges around compiling data center environmental footprints.
- In the second post we outlined the main current measurement methodologies, and documented their quantitative prescriptions in mathematical form.
- In the third post we searched for publicly available data about the environmental impact of data centers, and explored how to organize them inside the Equinox platform using a small data sample.
In this post the objective is dig deeper into the dataset obtained from OpenStreetMap, aiming to identify any significant data quality (DQ) issues and related challenges. DQ cannot be established independently of the uses we make of a given dataset: our main objective here is to explore the feasibility of environmental impact calculations, such as those pursued in 1 2 and related research, and this shapes also the DQ aspects we focus on.
Identifying Data Centers in OSM
As discussed in the (tools oriented) third post, the central data object we want to populate in the database is the Data Center data model. This is essentially a collection of attributes, some quantitative/numeric, some qualitative/categorical, some of geospatial nature, some of legal/economic nature and some concerning possible environmental impacts. OpenStreetMap (OSM) uses unique numeric identifiers known as OSM object IDs to distinguish between different geospatial elements in its database. The first order of business is thus to extract any such relevant object ID’s.
The reason we have any hope at all to obtain useful information from the OpenStreetMap database is that volunteers annotate geospatial features with informative tags that enrich the context of pure geospatial data
As a typical example, an OSM object identified as a data center, is located near Amsterdam, the Netherlands and has the following tags associated with it:
  <node id="7080092091" visible="true" version="4" changeset="171185721" timestamp="2025-08-29T13:51:11Z" user="A67-A67" uid="553736" lat="52.3830373" lon="4.7034029">
  <tag k="addr:city" v="Halfweg"/>
  <tag k="addr:housenumber" v="1"/>
  <tag k="addr:postcode" v="1165AA"/>
  <tag k="addr:street" v="Linieweg"/>
  <tag k="it_load" v="54 MW"/>
  <tag k="name" v="CyrusOne Amsterdam I"/>
  <tag k="office" v="company"/>
  <tag k="operator" v="CyrusOne"/>
  <tag k="operator:website" v="https://cyrusone.com"/>
  <tag k="source" v="BAG"/>
  <tag k="source:date" v="2019-12-23"/>
  <tag k="telecom" v="data_center"/>
  <tag k="website" v="https://cyrusone.com/locations/amsterdam-one/"/>
  </node>
The all-important tag in the above XML is the telecom key, which we can see has the value data_center. Documentation about the recommended use of this tag is provided here. We can search for this particular key-value pair by querying for any features in the OSM database that are tagged in this way. Overall the dataset produced with such a query identifies 1178 data centers, across the European Union.3
This approach raises immediately some important questions touching on data quality:
- Are all distinct objects in the OSM database that are actually data centers tagged in this particular way?
- Are all objects tagged as data centers in OSM actually data centers?
- Are all operating data centers in the European Union also identified as geospatial objects in OSM?
The first question is relatively easy to answer as there is only one other tag that is obviously associated with data centers. Namely there is an additional recommendation in OSM documentation to tag building objects as data centers when that is applicable (using a tag building=data_center). This is used sometimes in addition to the telecom tag and sometimes on its own. We will discuss this more in the Data Center Campus section below. Around 68% of data centers are thus tagged both as telecom=data_center and building=data_center.
The second question is harder. As discussed in the first post of this series, there is a general definitional challenge around the data center term: what is a data center in the first place? Such facilities can range from a simple server room housing IT equipment inside corporate headquarters, up to a large, multi-building, data center campus. The ownership and economic role of data centers is also widely varying. The very use of the “telecom” tag by the OSM community suggests that what counts as a data center has evolved over the years: the data center facilities making today’s news are not particularly related to the telecommunications sector.
The third source of uncertainty is whether the object tagging activity by the volunteer OSM community is complete. In other words, whether all visible outlines on the map that delineate data centers, are actually also tagged as such in the database. We might be able to obtain a sense for the coverage percentage by cross-checking with other sources of information.
In the first instance, a partial remedy for the above uncertainties is to focus on larger data centers. These are both harder to miss and can be cross-verified with other catalogs, e.g., information obtainable from corporate disclosures.
Geographical Distribution
Let us take a first look at the distribution of data center count among EU member countries:
| Country | Count |
|---|---|
| France | 370 |
| Germany | 253 |
| Netherlands | 115 |
| Ireland | 77 |
| Italy | 71 |
| Belgium | 40 |
| Spain | 30 |
| Finland | 29 |
| Sweden | 26 |
| Poland | 25 |
| Czechia | 23 |
| Hungary | 22 |
| Portugal | 16 |
| Austria | 15 |
| Denmark | 14 |
| Croatia | 11 |
| Luxembourg | 10 |
| Greece | 8 |
| Bulgaria | 6 |
| Romania | 6 |
| Latvia | 5 |
| Slovakia | 4 |
| Slovenia | 2 |
We see the anticipated prominence of larger countries, but there are, evidently, important additional factors at play, e.g., the Netherlands has nearly four times the data center count of Spain and and Ireland has more such facilities than Italy!
Incidentally we also see that not all 27 EU countries are represented. Namely four EU countries do not have even a single identifiable data center in the database. This may be reflecting ground truth, but it may also be indicative of missing data.
Identifying Data Center Operators
The next question concerns the economic context: given a tagged data center, what do we know about the owner, operator or other entity associated with the data center? This is of obvious importance for cross-referencing with other sources of information. Continuing with our example we have the following relevant pieces of information:
  <tag k="name" v="CyrusOne Amsterdam I"/>
  <tag k="operator" v="CyrusOne"/>
  <tag k="operator:website" v="https://cyrusone.com"/>
  <tag k="website" v="https://cyrusone.com/locations/amsterdam-one/"/>
The OSM documentation provides the following clarifications as to what the first two identification tags represent:
- operator: The operator of the datacenter. In the case of a corporate datacenter, this will be the organisation which owns it. In the case of a colocation facility, this will be the colocation company.
- name: The name of the datacenter.
Additional tags that provide potentially relevant information (but not present in the above example):
- ref: The operator’s reference for the datacenter (usually a three or four character abbreviation).
- owner: Some datacenters are constructed and owned by one company, but long-term leased in their entirety to another company to operate.
Operator Distribution
Next we take a look at the distribution of data center counts per operator (corporate entity). There are 328 unique operator names in total.
Unfortunately only 67% of tagged datacenters have an explicitly identified operator attribute. Using other data fields and geospatial tools we might be able to identify a few more, this is clearly a data quality issue. In the worst case it might prevent enriching the data set with the additional information we need towards assessing environmental impact.
For brevity we display below only the dozen or so operators that operate at least 10 datacenters, while there is in fact a long tail of 316 other operators which operate a smaller number of facilities.
| Operator | Count |
|---|---|
| Digital Realty | 66 |
| Equinix | 61 |
| Microsoft | 38 |
| Bouygues Télécom | 26 |
| Amazon Web Services | 24 |
| SFR | 17 |
| NorthC | 15 |
| Datacenter United | 10 |
| 10 | |
| Meta | 10 |
| data4 | 10 |
| EdgeConneX | 10 |
In this list we notice the presence of both colocation center operators (allowing a diverse set of tenants to share a data center), cloud providers and enterprise data centers that server primarily an entity’s own IT needs.
Available Geospatial Data
Given that we have a tagged data center object, what do we know about its spatial extent? The possible answers are catalogued as follows:
- A Point geometry (where no spatial extent is known) - map features have not been elevated into geometry objects.
- A Polygon geometry (which, in-principle, can also be turned into a surface area). A polygon geometry may further indicate either:
- A Building, in which case the enclosed surface area may become a proxy for impact calculations (subject to various other conditions).
- An encompassing Land Parcel (Campus), which may include many other buildings, in which case the surface area information is less informative.
- A LineString or MultiPolygon geometry, which needs further examination as it suggest non-trivial geometrical features.
If we run the numbers for the available geometries for the OSM identified data centers, we get the following count statistics:
| Geometry | Count |
|---|---|
| Polygon | 852 |
| Point | 304 |
| LineString | 19 |
| MultiPolygon | 3 |
Thus we do have a majority of Polygon geometries (good!) but also a significant number of simple Locations / Points. We’ll leave the LineString and MultiPolygon geometries out of scope, as they are both small in number and, in the case of LineString, not particularly appropriate to use to demarcate a closed area.
An important point is the following:
More complex geometries such as polygons can always be simplified into points (e.g., computing a centroid or barycenter). This point-like representation may already be adequate for various types of analyses.
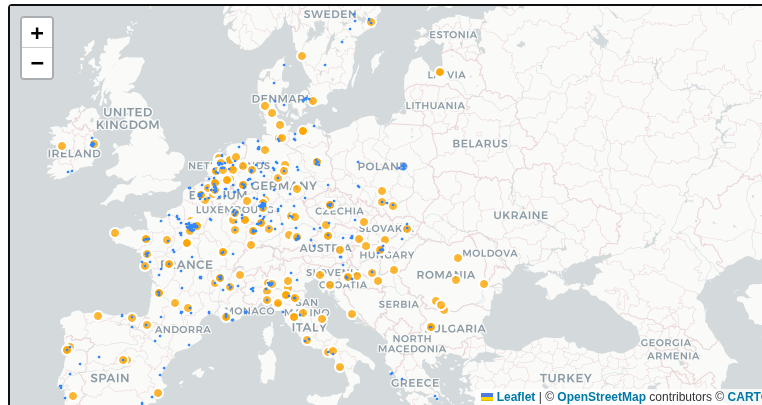
Our preliminary result applying the above is as follows:
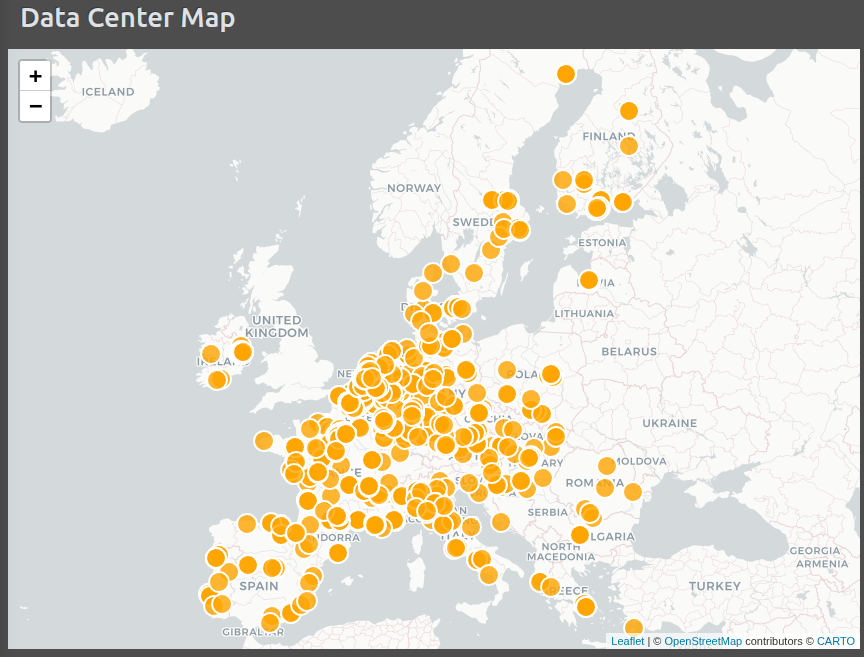
Thus an important certainty we do have about OSM data center data is that we always have an overall location of an object, expressed concretely as a longitude and latitude pair. This certainty simply reflects the nature of the OSM database: it can not include objects without any geospatial attribute.
The more ambitious geospatial question therefore is: can we compute a reasonably accurate floor space for any of the identified data centers?4. For this we need to be able to answer positively the following two questions:
- Is the Polygon describing a building rather than a land parcel, in which case the surface area might be significantly larger.
- How many levels (stories or floors) does the building have, since the effective floor space does depend on this dimension.
Separating Buildings from Land Areas
On whether we can identify Polygons that are buildings from the OSM documentation we obtain the following explanation: the building tag is used to mark a given object as a building. This is a man-made structure with a roof, standing more or less permanently in one place. The most basic use is building=yes, but the value may be used to classify the architectural type of building.
The full list of European data center objects with an available building tag is as follows:
| Building | Count |
|---|---|
| yes | 292 |
| data_center | 287 |
| industrial | 76 |
| commercial | 60 |
| office | 34 |
| service | 26 |
| university | 7 |
| construction | 6 |
| warehouse | 2 |
| bunker | 2 |
| skyscraper | 1 |
| hall | 1 |
| civic | 1 |
| college | 1 |
| government | 1 |
| administrative | 1 |
| outbuilding | 1 |
Thus for a fraction of objects we have explicit confirmation that the object is indeed a building, but there is diversity of other possible values the precise meaning of which must be verified on a case-by-case basis. For example, when the tag value is construction, is the outline of the building already visible?
Aggregating campus-wide data
We discussed in the third post that, to the extend that companies breakout any data center footprints in their sustainability reporting, this does not happen at the building / individual facility, but rather at the so-called campus level, which is the aggregate of several nearby facilities.
OSM data for floor space will in-principle be building specific while reported corporate impact metrics will be campus specific. Thus identifying, associating and aggregating a number of distinct but related data centers objects into campus objects is necessary before any such disclosures can be integrated.
How many floors?
While many data centers are single floor structures, it will be important to more robustly identify multi-level structures, as the vertical dimension can significantly multiply the environmental intensity impact per surface area.
On the question for how many floors a given data center has, the building:levels tag is used for marking the actual number of above-ground, non-roof, levels (=floors or storeys) of a building. Unfortunately only 11% of data centers in OSM have an associated number of levels.
The distribution of number of levels is as follows:
| Building:levels | Count |
|---|---|
| 1 | 17 |
| 2 | 41 |
| 3 | 34 |
| 4 | 16 |
| 5 | 15 |
| 6 | 4 |
| 7 | 2 |
| 15 | 1 |
| 23 | 1 |
The presence in the OSM dataset of data centers that are described as skyscraper buildings and having e.g., 15 or 23 levels suggests the need for individual review as it is unlikely those levels are occupied by IT equipment.
Calculating Data Center Surface Area
Calculating a data center’s surface area given a polygon geometry is a standard exercise in geospatial data processing. For sufficiently small objects (given data centers are not yet planetary scale!) a spherical model offers as simple approximation that converts angles to distances.
Using the Polygon geometries extracted from the OSM database and after filtering out objects that correspond to land parcels rather than buildings we get a preliminary distribution of data center size as illustrated in the histogram below:
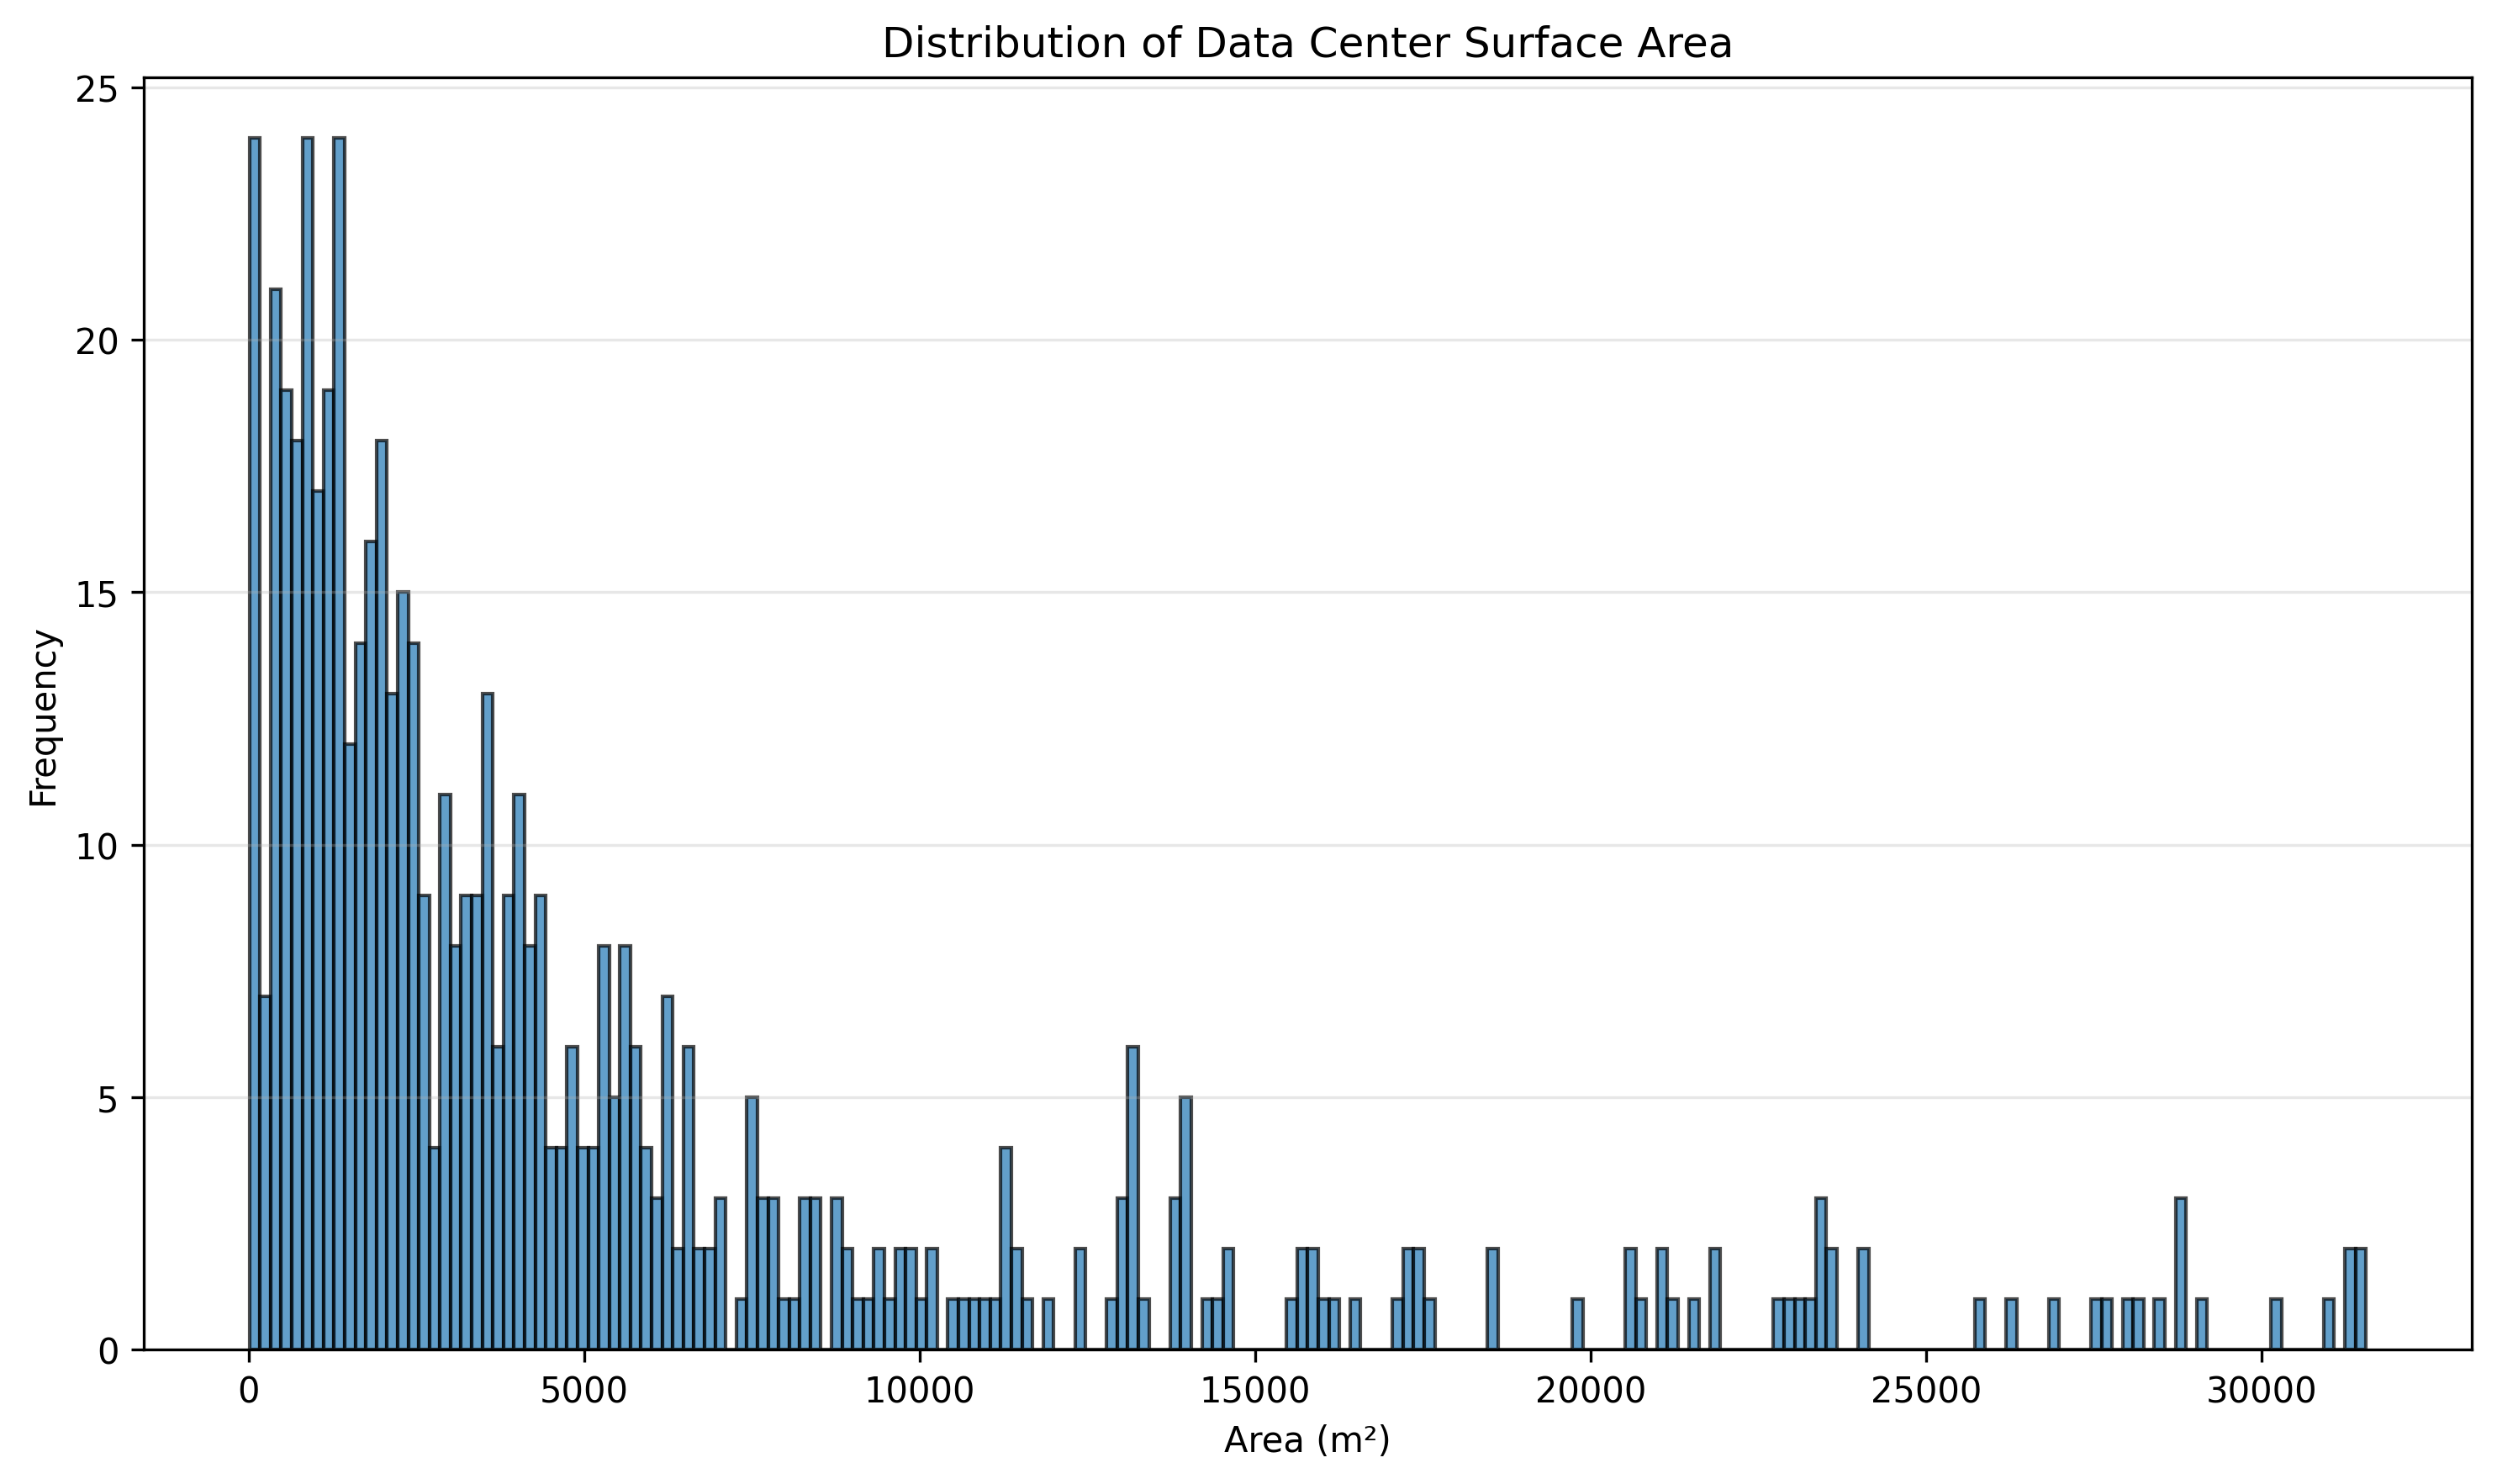
When looking at the size distribution of data centers we do notice the existence of very large (hyperscale) data centers (e.g. in excess of 10,000 $m^2$) but also a large number of smaller facilities, the impact of which can add-up. Other things being equal, the aggregate variable that weighs most heavily on overall environmental impact is the total surface area that is used by data center equipment5. The specifics of its geographic distribution (whether concentrated in larger data centers or dispersed in smaller units) is a distinct factor. E.g., spatial concentration is important when addressing localized impacts such as water usage or impact on local electricity grids.
Tis but a Starting Point!
After taking a first look at what information we can extract from the OpenStreetMap database towards compiling a data center catalog we can both be satisfied at the wealth of information that is already available and the challenges towards using it for developing a robust and useful environmental footprint database.
- A large number of objects (> 1000) are already identified, including many data center operators (> 300): this allows linking with other sources
- Objects always provide locations and even surface areas via outline geometries. Those geospatial features can be used to relate to local environmental conditions and potentially also sizing the environmental footprint following the floor space method to estimate energy usage.
The first set of DQ challenges we identified concern cleaning up, integrating and enriching the available geospatial data so that they are reliable (complete, accurate, representative). This may involve examining objects also on an individual basis. But such geospatial information is only one aspect of the compilation journey. Further questions and additional required data points will be of a different nature and must be sourced elsewhere.
Indicatively some important questions down the line:
- Is the data center operational?
- What type IT and non-IT equipment is operated inside the data center.
- What sources of energy and cooling water are used? (On-site generation, grid etc.)
- How efficient/wasteful is this equipment in terms of energy and water usage? (The PUE and WUE intensities)
- What are the environmental parameters of the region in which the data center operates, e.g., in terms of grid energy mix, water stress levels etc.
References
-
Alex de Vries-Gao, The carbon and water footprints of data centers and what this could mean for artificial intelligence, Patterns 7, 2026 ↩︎
-
Siddik, et al. (2021). The environmental footprint of data centers in the United States. Environ. Res. Lett. 16 ↩︎
-
All figures are based on May 2026 OSM data ↩︎
-
As a reminder of why this metric is relevant, given floor space and suitable energy / environmental impact intensities one can estimate the overall footprint of a facility ↩︎
-
The associated environmental impact intensity, impact per surface are unit is also required and can play a dramatic multiplier role. But that parameter cannot be obtained from purely geospatial data, must be supplemented from other sources. ↩︎